Project Blue Book Special Report No. 14 (Analysis of Reports of Unidentified Aerial Objects)
CIA-UAP-015 · page 114 of 312
Text
This text came with the file. It may have mistakes. When the text and the image disagree, the image is right.
I
I
I
I
I
I
I
I
I
I
I
I
I
I
I
I
I
I
I
I
I
I
Table A206.
Table A207.
Table A208.
Table A209.
Table A210.
Table A211.
Table A212.
Table A213.
Table A214.
Table A215.
Table A216.
Table A2 l 7.
Table A218.
Table A219.
Table A220.
Table A221.
Table A222.
Table A223.
Table A224.
Table A225.
Table A226.
Table A227.
Table A228.
Table A229.
Table A230.
Table A231.
Table A232.
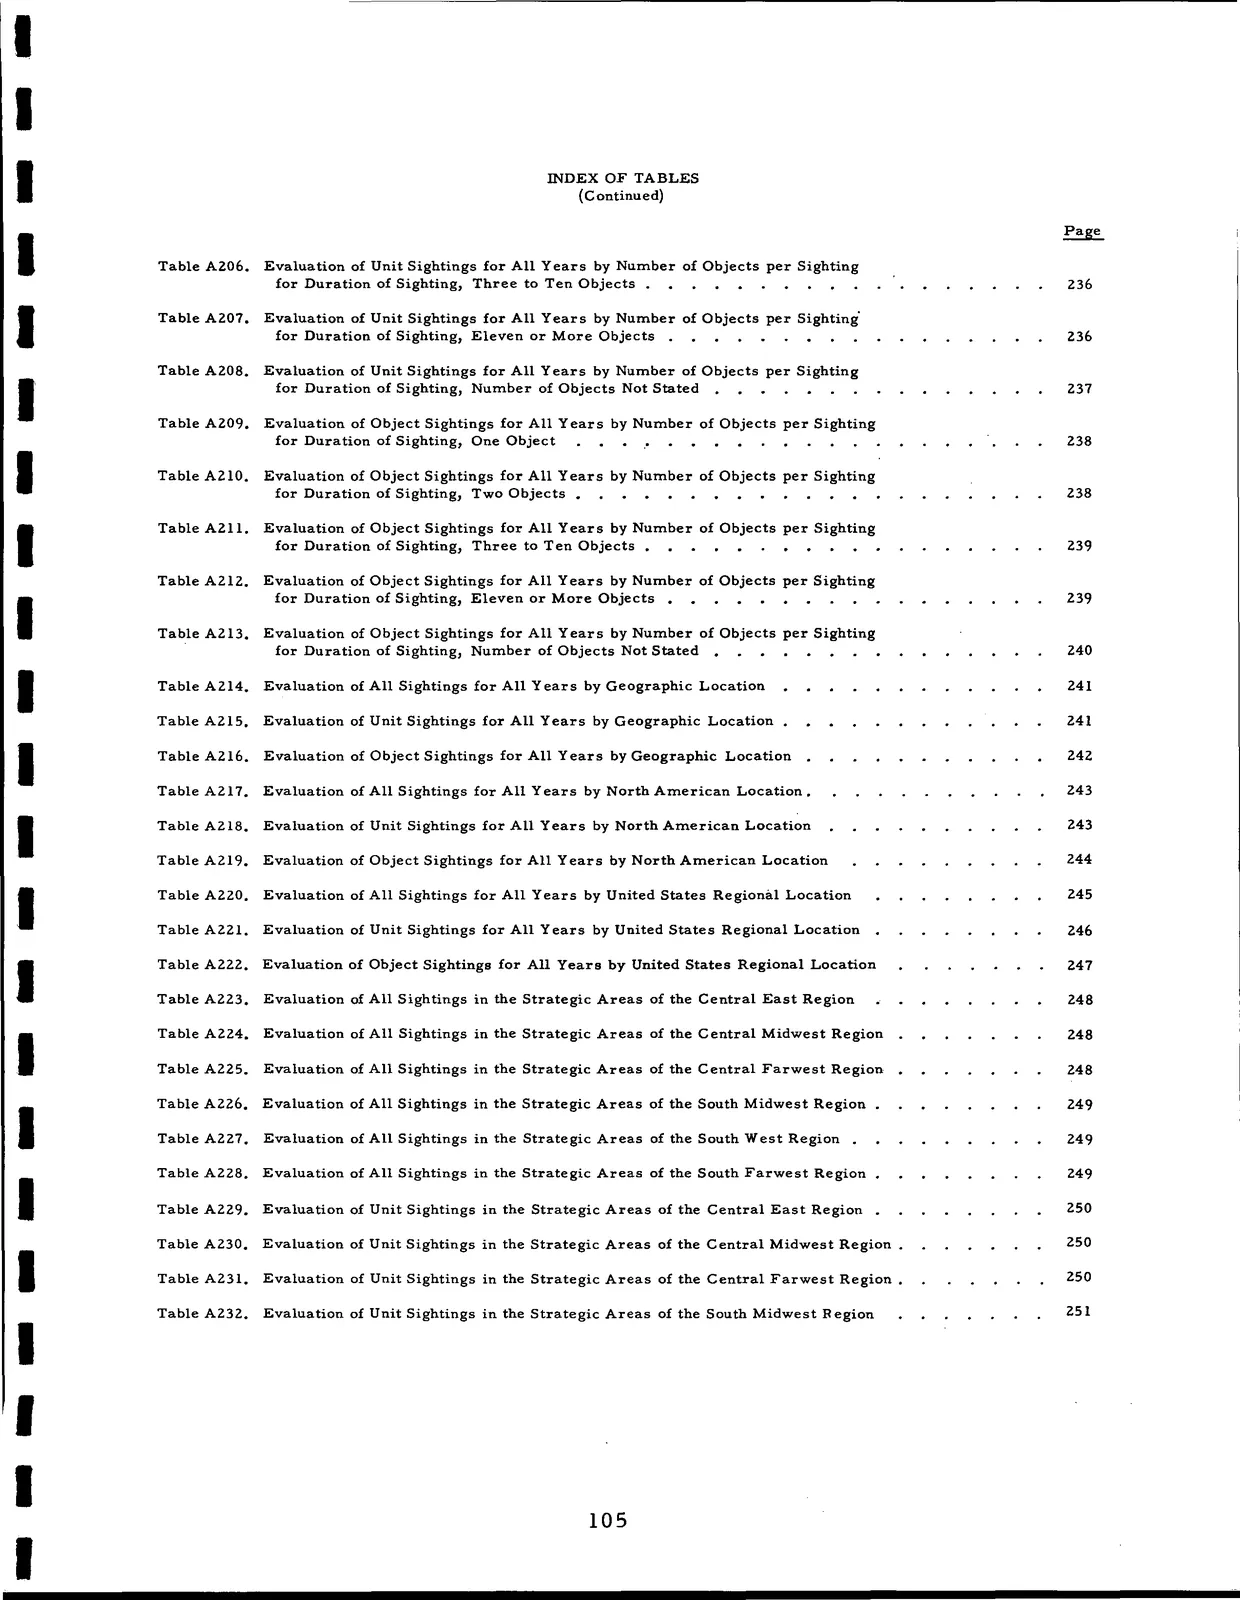
INDEX OF TABLES
(Continued)
Evaluation of Unit Sightings for All Years by Number of Objects per Sighting
for Duration of Sighting, Three to Ten Objects .
Evaluation of Unit Sightings for All Years by Number of Objects per Sighting'
for Duration of Sighting, Eleven or More Objects .
Evaluation of Unit Sightings for All Years by Number of Objects per Sighting
for Duration of Sighting, Number of Objects Not Stated
Evaluation of Object Sightings for All Years by Number of Objects per Sighting
for Duration of Sighting, One Object
Evaluation of Object Sightings for All Years by Number of Objects per Sighting
for Duration of Sighting, Two Objects .
Evaluation of Object Sightings for All Years by Number of Objects per Sighting
for Duration of Sighting, Three to Ten Objects •
Evaluation of Object Sightings for All Years by Number of Objects per Sighting
for Duration of Sighting, Eleven or More Objects •
Evaluation of Object Sightings for All Years by Number of Objects per Sighting
for Duration of Sighting, Number of Objects Not Stated •
Evaluation of All Sightings for All Years by Geographic Location
Evaluation of Unit Sightings for All Years by Geographic Location
Evaluation of Object Sightings for All Years by Geographic Location
Evaluation of All Sightings for All Years by North American Location.
Evaluation of Unit Sightings for All Years by North American Location
Evaluation of Object Sightings for All Years by North American Location
Evaluation of All Sightings for All Years by United States Regional Location
Evaluation of Unit Sightings for All Years by United States Regional Location
Evaluation of Object Sightings for All Years by United States Regional Location
Evaluation of All Sightings in the Strategic Areas of the Central East Region
Evaluation of All Sightings in the Strategic Areas of the Central Midwest Region
Evaluation of All Sightings in the Strategic Areas of the Central Farwest Region
Evaluation of All Sightings in the Strategic Areas of the South Midwest Region
Evaluation of All Sightings in the Strategic Areas of the South West Region .
Evaluation of All Sightings in the Strategic Areas of the South Farwest Region
Evaluation of Unit Sightings in the Strategic Areas of the Central East Region
Evaluation of Unit Sightings in the Strategic Areas of the Central Midwest Region
Evaluation of Unit Sightings in the Strategic Areas of the Central Farwest Region .
Evaluation of Unit Sightings in the Strategic Areas of the South Midwest Region
236
236
237
238
238
239
239
240
241
241
242
243
243
244
245
246
247
248
248
248
249
249
249
250
250
250
251