Project Blue Book Special Report No. 14 (Analysis of Reports of Unidentified Aerial Objects)
CIA-UAP-015 · page 5 of 312
Text
This text came with the file. It may have mistakes. When the text and the image disagree, the image is right.
I
I
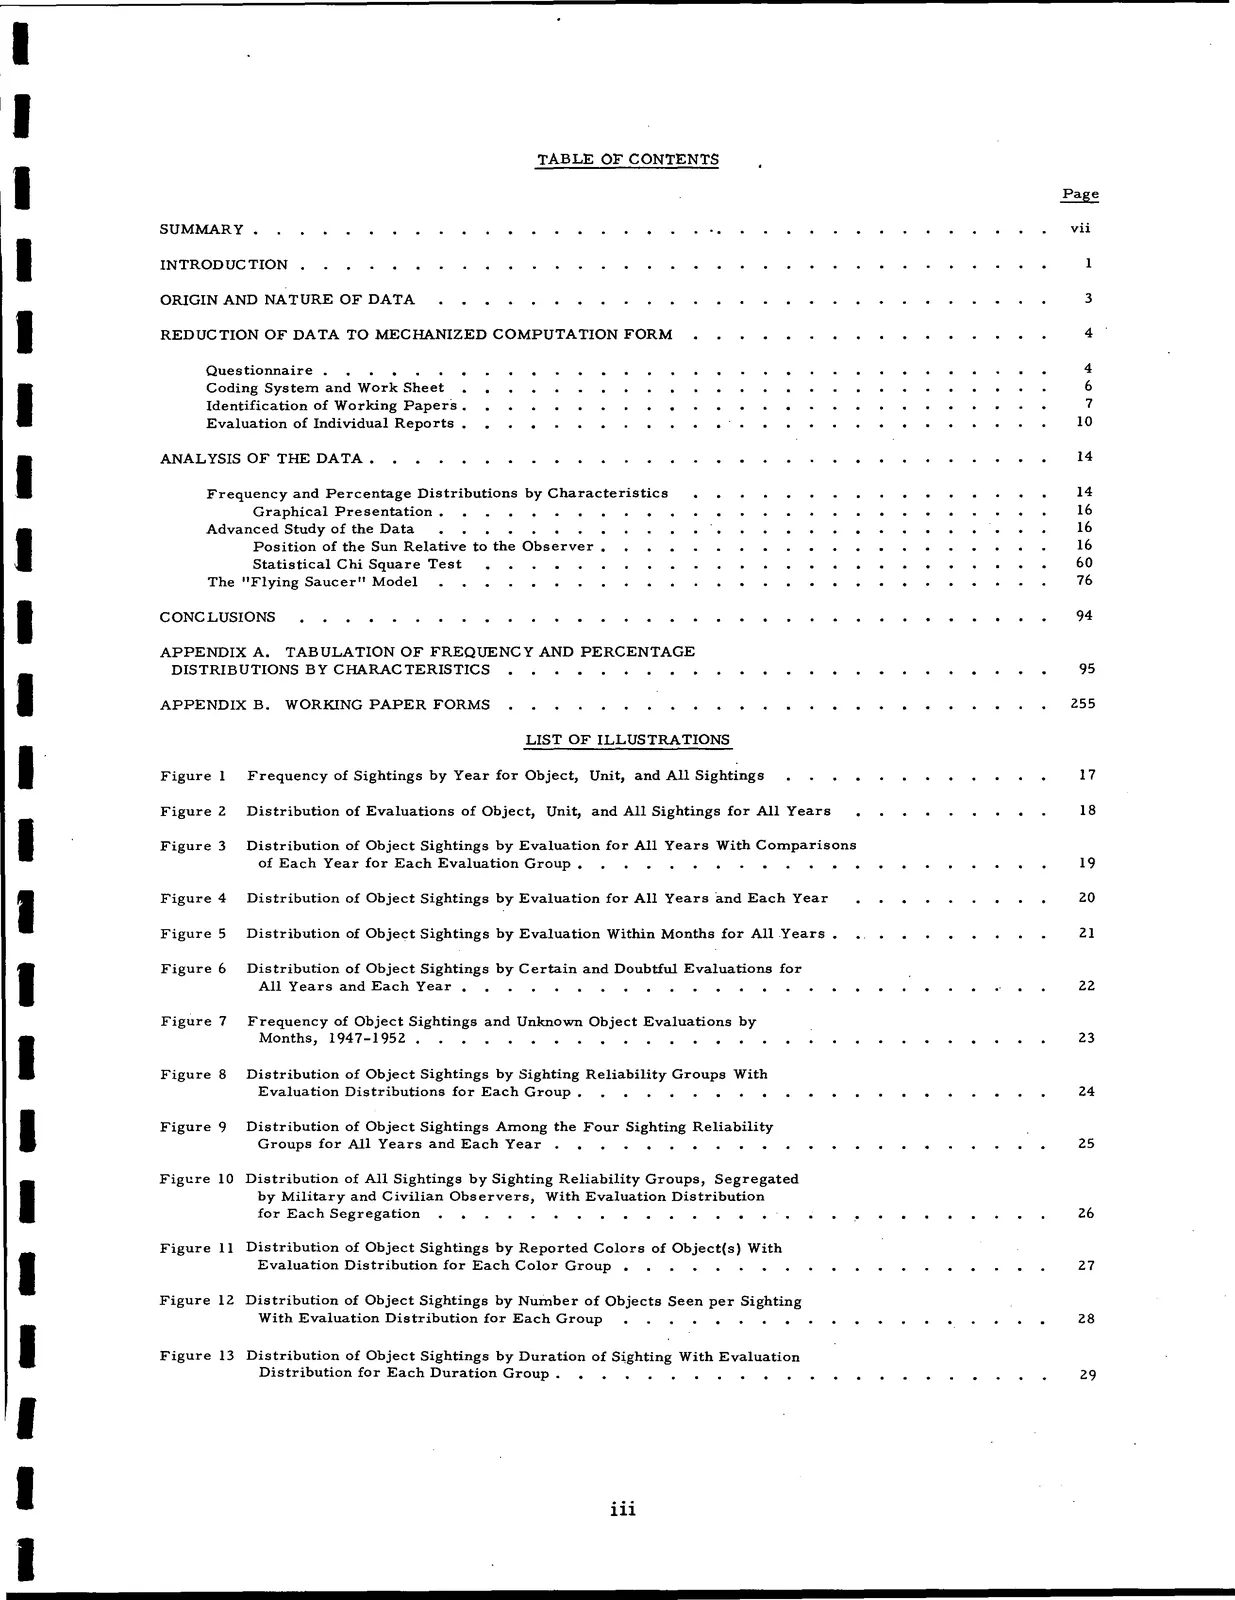
TABLE OF CONTENTS
I
SUMMARY.
vii
I
INTRODUCTION
ORIGIN AND NATURE OF DATA
3
I
REDUCTION OF DATA TO MECHANIZED COMPUTATION FORM
4
I
Questionnaire .
4
Coding System and Work Sheet
6
Identification of Working Papers.
7
Evaluation of Individual Reports
10
I
ANALYSIS OF THE DATA.
14
I
Frequency and Percentage Distributions by Characteristics
14
Graphical Presentation .
16
Advanced Study of the Data
16
Position of the Sun Relative to the Observer
16
Statistical Chi Square Test
60
The "Flying Saucer" Model
76
I
CONCLUSIONS
94
I
APPENDIX A.
TABULATION OF FREQUENCY AND PERCENTAGE
DISTRIBUTIONS BY CHARACTERISTICS
95
APPENDIX B. WORKING PAPER FORMS
255
Figure l
I
Figure 2
I
Figure 3
I
Figure 4
Figure 5
I
Figure 6
Figure 7
I
Figure 8
I
Figure 9
I
Figure 10
I
Figure 11
Figure 12
I
Figure 13
I
I
LIST OF ILLUSTRATIONS
Frequency of Sightings by Year for Object, Unit, and All Sightings
17
Distribution of Evaluations of Object, Unit, and All Sightings for All Years
18
Distribution of Object Sightings by Evaluation for All Years With Comparisons
of Each Year for Each Evaluation Group •
19
Distribution of Object Sightings by Evaluation for All Years and Each Year
20
Distribution of Object Sightings by Evaluation Within Months for All Years
21
Distribution of Object Sightings by Certain and Doubtful Evaluations for
All Years and Each Year •
22
Frequency of Object Sightings and Unknown Object Evaluations by
Months, 1947-1952.
23
Distribution of Object Sightings by Sighting Reliability Groups With
Evaluation Distributions for Each Group .
24
Distribution of Object Sightings Among the Four Sighting Reliability
Groups for All Years and Each Year .
25
Distribution of All Sightings by Sighting Reliability Groups, Segregated
by Military and Civilian Observers, With Evaluation Distribution
for Each Segregation
26
Distribution of Object Sightings by Reported Colors of Object(s) With
Evaluation Distribution for Each Color Group •
27
Distribution of Object Sightings by Number of Objects Seen per Sighting
With Evaluation Distribution for Each Group
28
Distribution of Object Sightings by Duration of Sighting With Evaluation
Distribution for Each Duration Group .
29
iii
I