Project Blue Book Special Report No. 14 (Analysis of Reports of Unidentified Aerial Objects)
CIA-UAP-015 · page 52 of 312
Text
This text came with the file. It may have mistakes. When the text and the image disagree, the image is right.
----------------------
Total Less Balloon
Balloon
Per Cent
Per Cent
40
30
20
10
0
0
10
20
30
40
January
l
t
February
Morch
April
Moy
~
June
I\)
July
August
September
October
November
December
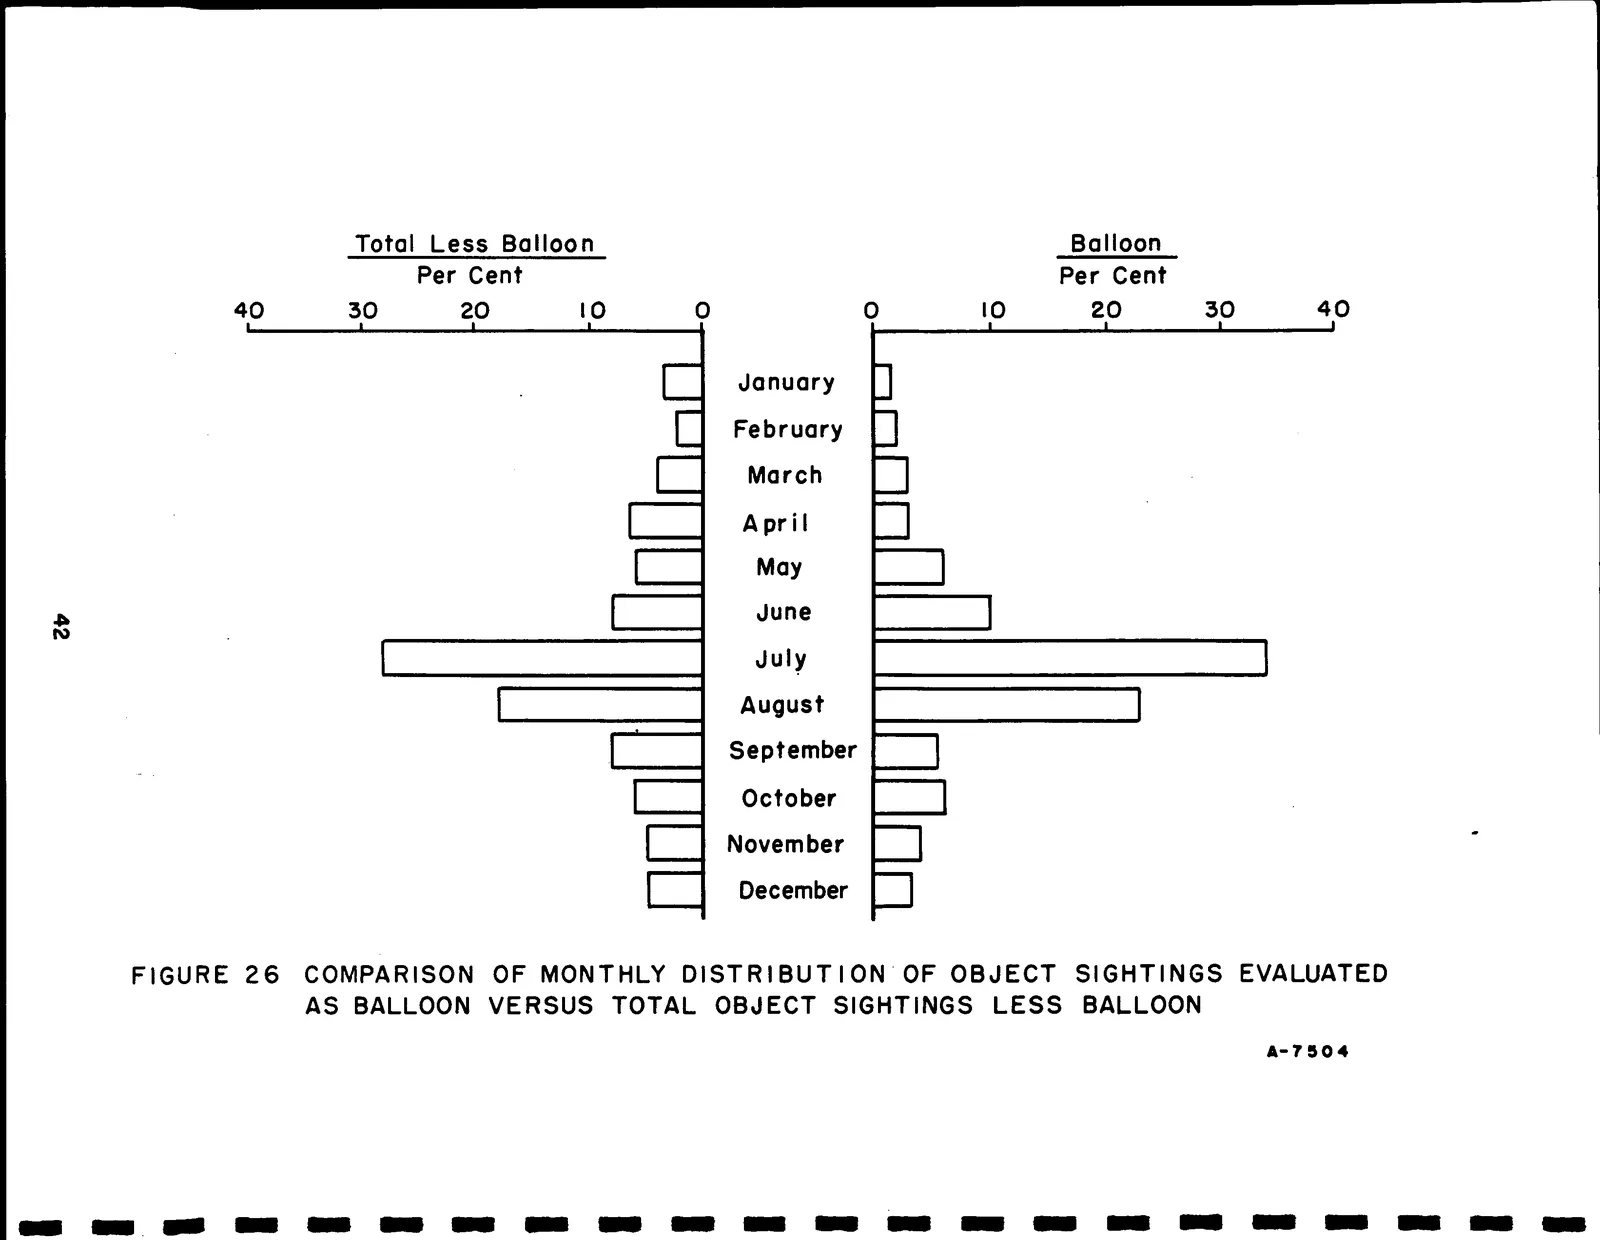
FIGURE 26 COMPARISON OF MONTHLY DISTRIBUTION OF OBJECT SIGHTINGS EVALUATED
AS BALLOON VERSUS TOTAL OBJECT SIGHTINGS LESS BALLOON
A-7 504