Project Blue Book Special Report No. 14 (Analysis of Reports of Unidentified Aerial Objects)
CIA-UAP-015 · page 70 of 312
Text
This text came with the file. It may have mistakes. When the text and the image disagree, the image is right.
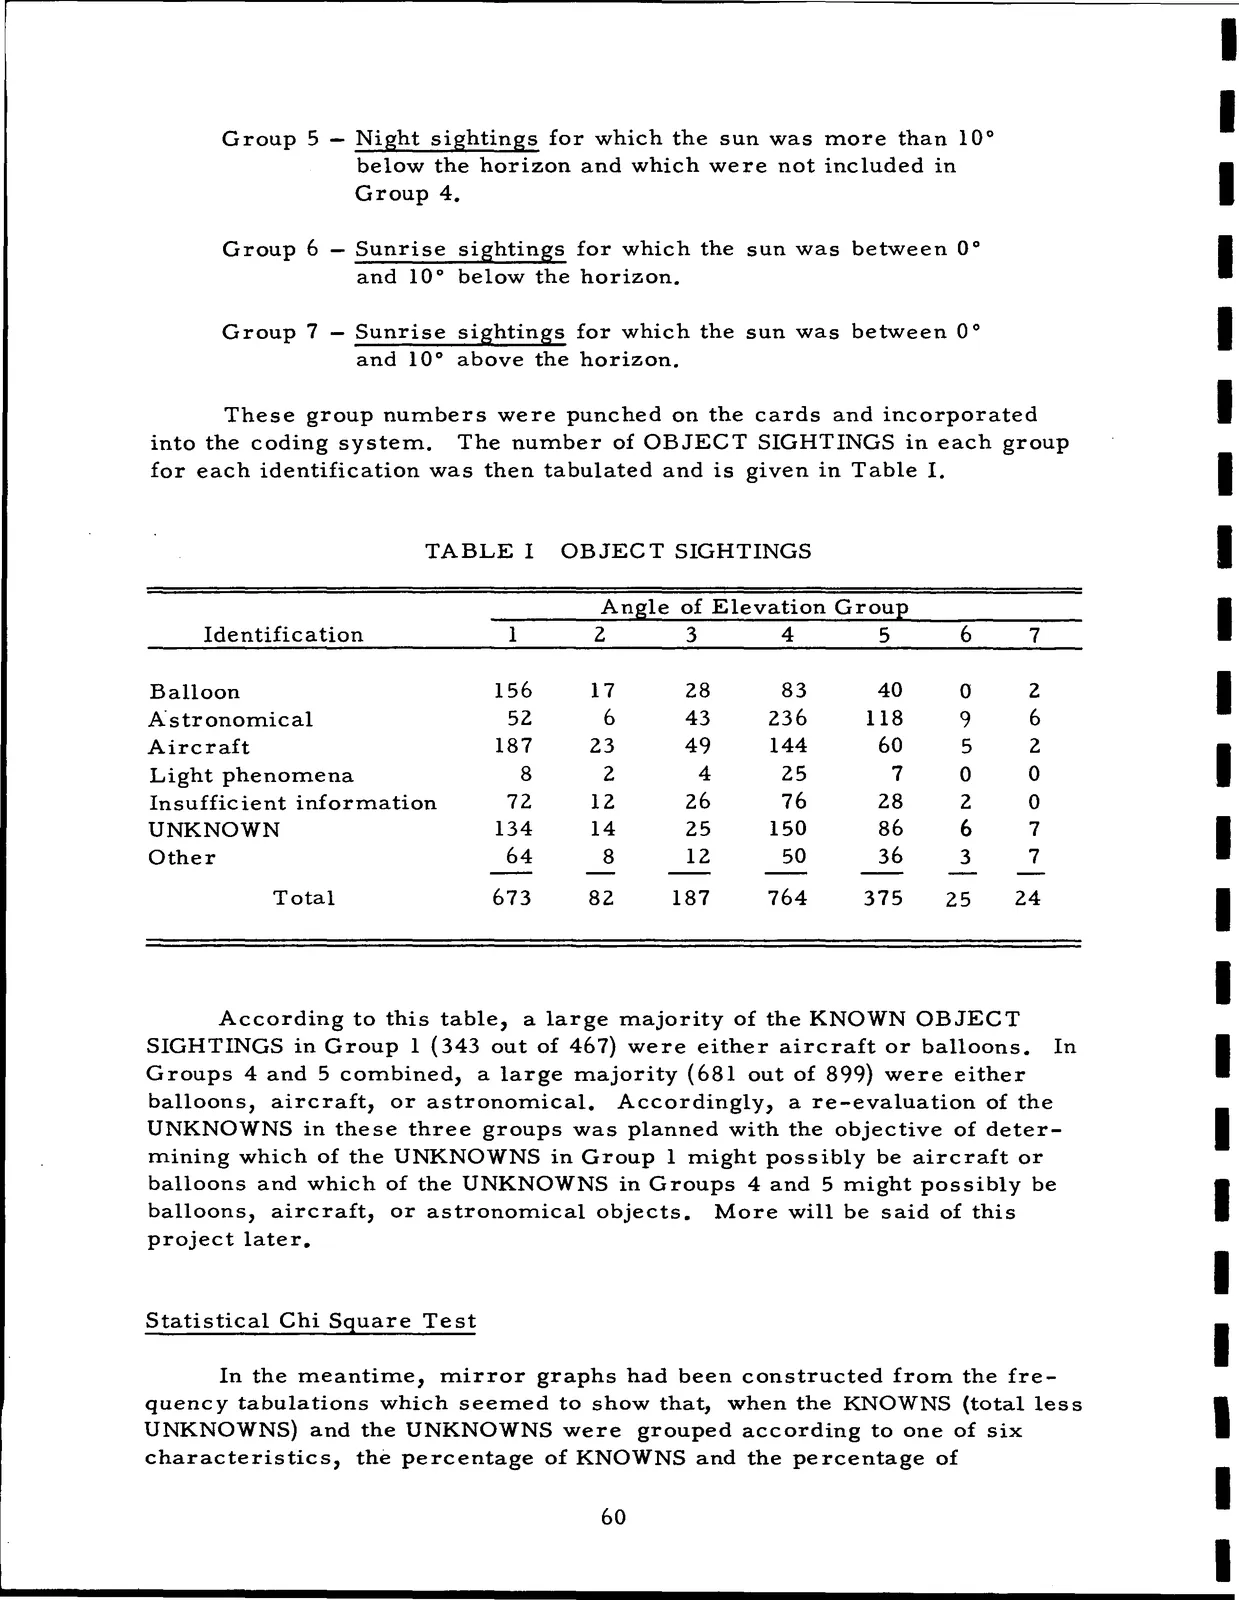
I I Group 5 - Night sightings for which the sun was more than 10° below the horizon and which were not included in Group 4. I Group 6 - Sunrise sightings for which the sun was between 0° I and 10° below the horizon. Group 7 - Sunrise sightings for which the sun was between O 0 I and 10° above the horizon. These group numbers were punched on the cards and incorporated I into the coding system. The number of OBJECT SIGHTINGS in each group for each identification was then tabulated and is given in Table I. I TABLE I OBJECT SIGHTINGS I Angle of Elevation Group Identification 1 2 3 4 5 6 7 I Balloon 156 17 28 83 40 0 2 I Astronomical 52 6 43 236 118 9 6 Aircraft 187 23 49 144 60 5 2 Light phenomena 8 2 4 25 7 0 0 I Insufficient information 72 12 26 76 28 2 0 UNKNOWN 134 14 25 150 86 6 7 Other 64 8 12 50 36 3 7 I Total 673 82 187 764 375 25 24 I I According to this table, a large majority of the KNOWN OBJECT SIGHTINGS in Group 1 (343 out of 467) were either aircraft or balloons. In Groups 4 and 5 combined, a large majority (681 out of 899) were either I balloons, aircraft, or astronomical. Accordingly, a re-evaluation of the UNKNOWNS in these three groups was planned with the objective of deter I mining which of the UNKNOWNS in Group 1 might possibly be aircraft or balloons and which of the UNKNOWNS in Groups 4 and 5 might possibly be balloons, aircraft, or astronomical objects. More will be said of this I project later. I Statistical Chi Square Test I In the meantime, mirror graphs had been constructed from the fre quency tabulations which seemed to show that, when the KNOWNS (total less UNKNOWNS) and the UNKNOWNS were grouped according to one of six I characteristics, the percentage of KNOWNS and the percentage of 60 I I