AAWSAP DIRD, An Introduction to the Statistical Drake Equation, March 2010
DOW-UAP-D127 · page 52 of 55
Text
This text came with the file. It may have mistakes. When the text and the image disagree, the image is right.
UNCLASSIFIED/ /fOR OFFI&IAk Wlii QPU,¥
that is
(148)
(149)
Since from the definition (147) one obviously has
erf(0)=0, (149) yields
This is the median of the lognormal distribution of
N.
Ill other words, this is the number of
ExtraTerrestrial civilizatio11s i11 the Galaxy such
that, with 50% probability the actual value of N will
be lower tha11 this median, and with 50% probability
it will be higher.
In conclusion, we feel useful to summarize all the
equations that we derived about the random variable
N in the following Table 2.
NUMERICAL EXAMPLE OF THE
ET_DISTANCE DISTRIBUTION
ln this section we provide a numerical
example of the analytic calculations carried on so
far.
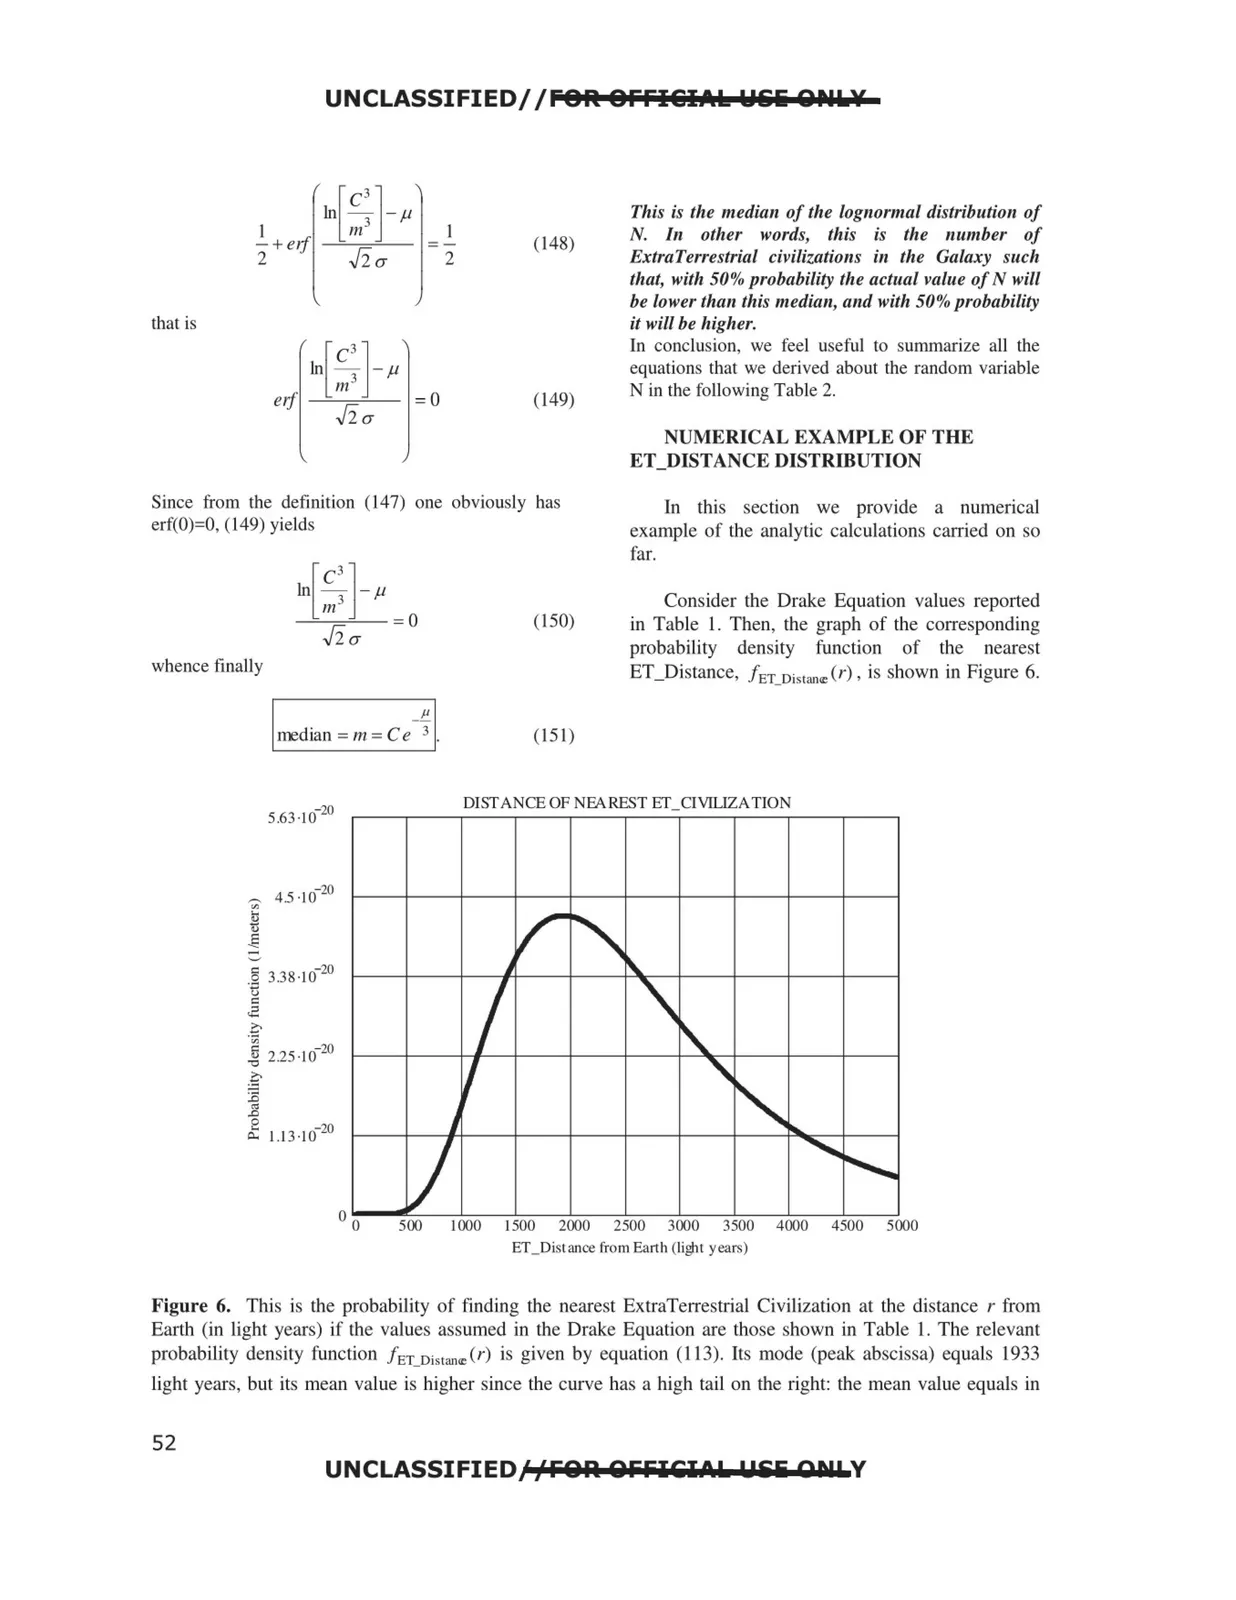
Consider the Drake Equation values reported
(150)
in Table 1. Then, the graph of the corresponding
probability
density
function
of the
nearest
whence finally
ET _Distance, f ET_Distan"' (r), is shown in Figure 6.
Imedian= m= Ce-~ 1.
(151)
DISTANCE OF NEAREST Er_CIVILIZA TION
5.63·10-20
500
I000
I500
2000
2500
3000
3500
4000
4500
5000
ET_Distance from Earth (ligJ,t years)
Figure 6. This is the probability of finding the nearest ExtraTerrestrial Civilization at the distance r from
Earth (in light years) if the values assumed in the Drake Equation are those shown in Table I. The relevant
probability density function f ET_Distano:Cr) is given by equation (113). Its mode (peak abscissa) equals 1933
light years, but its mean value is higher since the curve has a high tail on the right: the mean value equals in
UNCLASSIFIED/fFQA QFFICiIPL. PP&i ODI! Y
52