AAWSAP DIRD, Quantum Tomography of Negative Energy States in the Vacuum, January 2011
DOW-UAP-D153 · page 24 of 51
Text
This text came with the file. It may have mistakes. When the text and the image disagree, the image is right.
UNCLASSIFIED//FOR OFFl@IAL Y!H! 8HL'I
0
50
100
150
200
Time rmsl
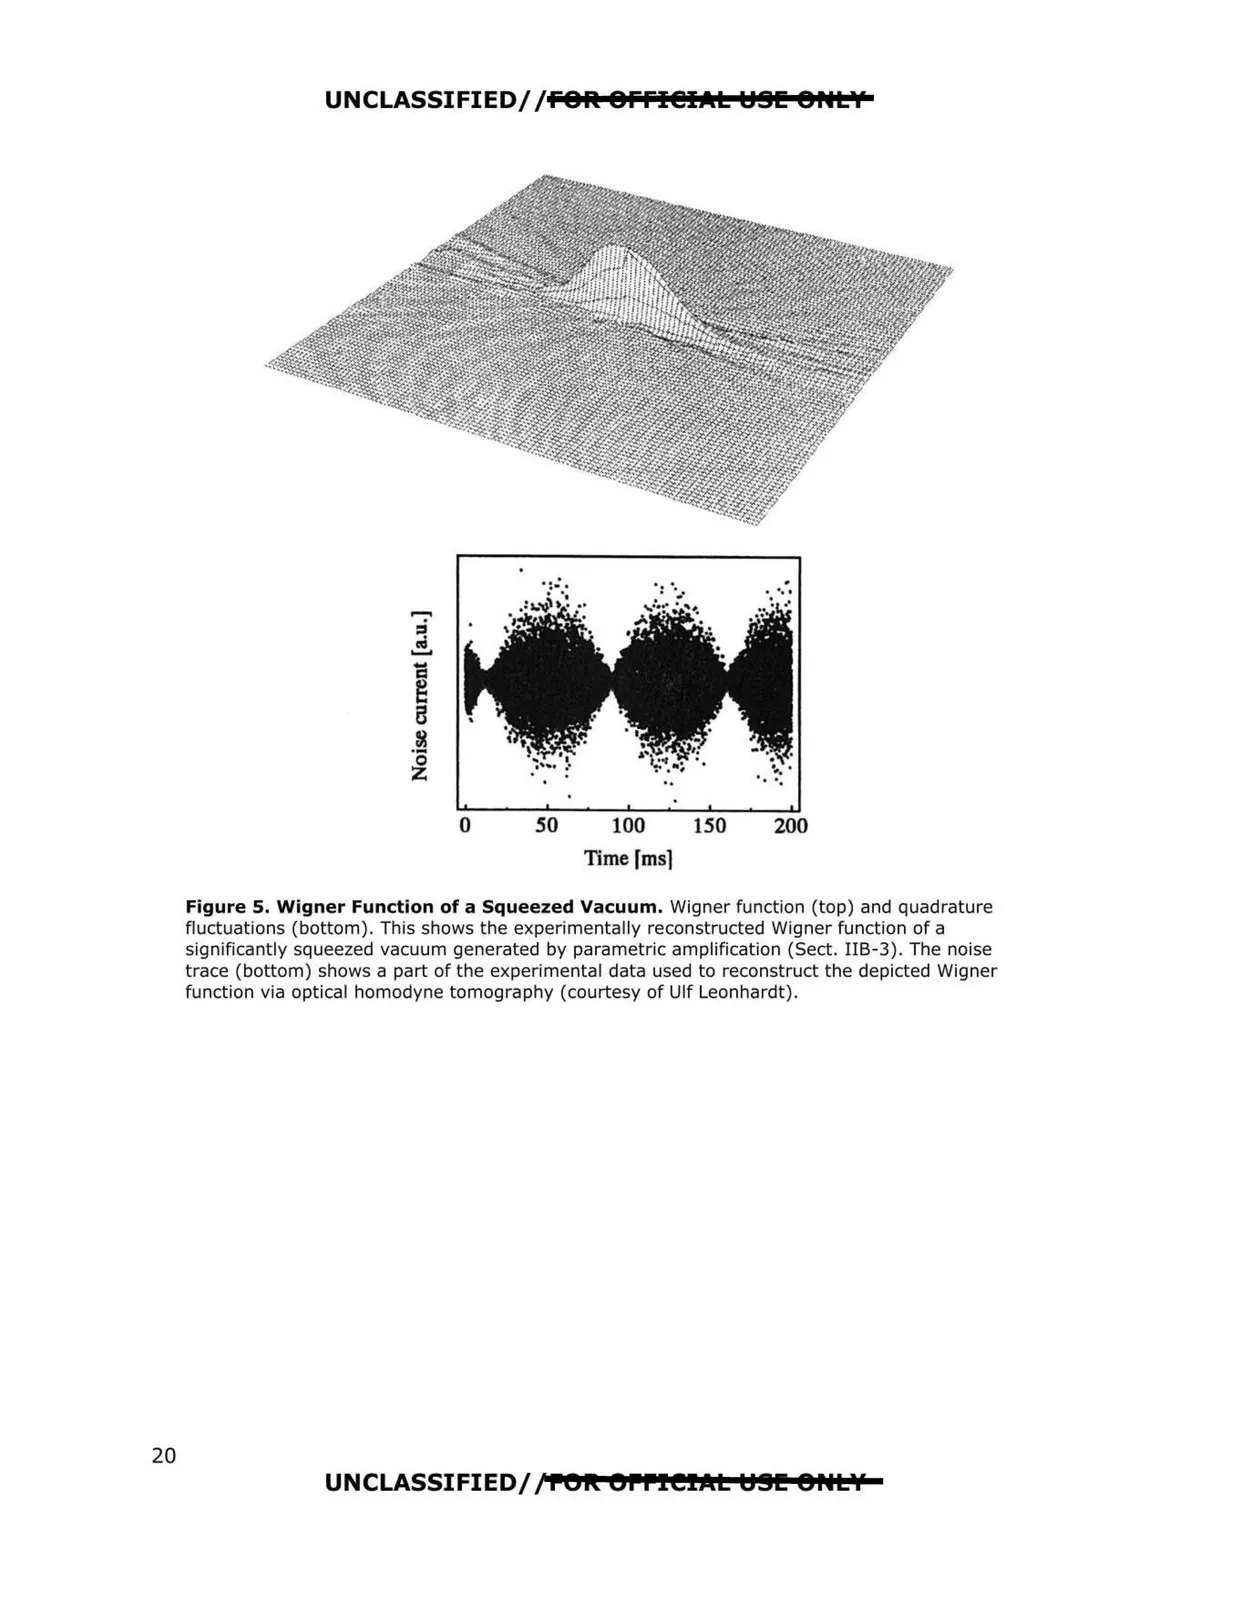
Figure S. Wigner Function of a Squeezed Vacuum. Wigner function (top) and quadrature
fluctuations (bottom). This shows the experimentally reconstructed Wigner function of a
significantly squeezed vacuum generated by parametric amplification (Sect. IIB-3). The noise
trace (bottom) shows a part of the experimental data used to reconstruct the depicted Wigner
function via optical homodyne tomography (courtesy of Ulf Leonhardt).
UNCLASSIFIED/i POlt OPPlelJcL Y.!l!! 8HLY
20