Department of the Air Force Report, 1996
DOW-UAP-D048 · page 157 of 181
Text
This text came with the file. It may have mistakes. When the text and the image disagree, the image is right.
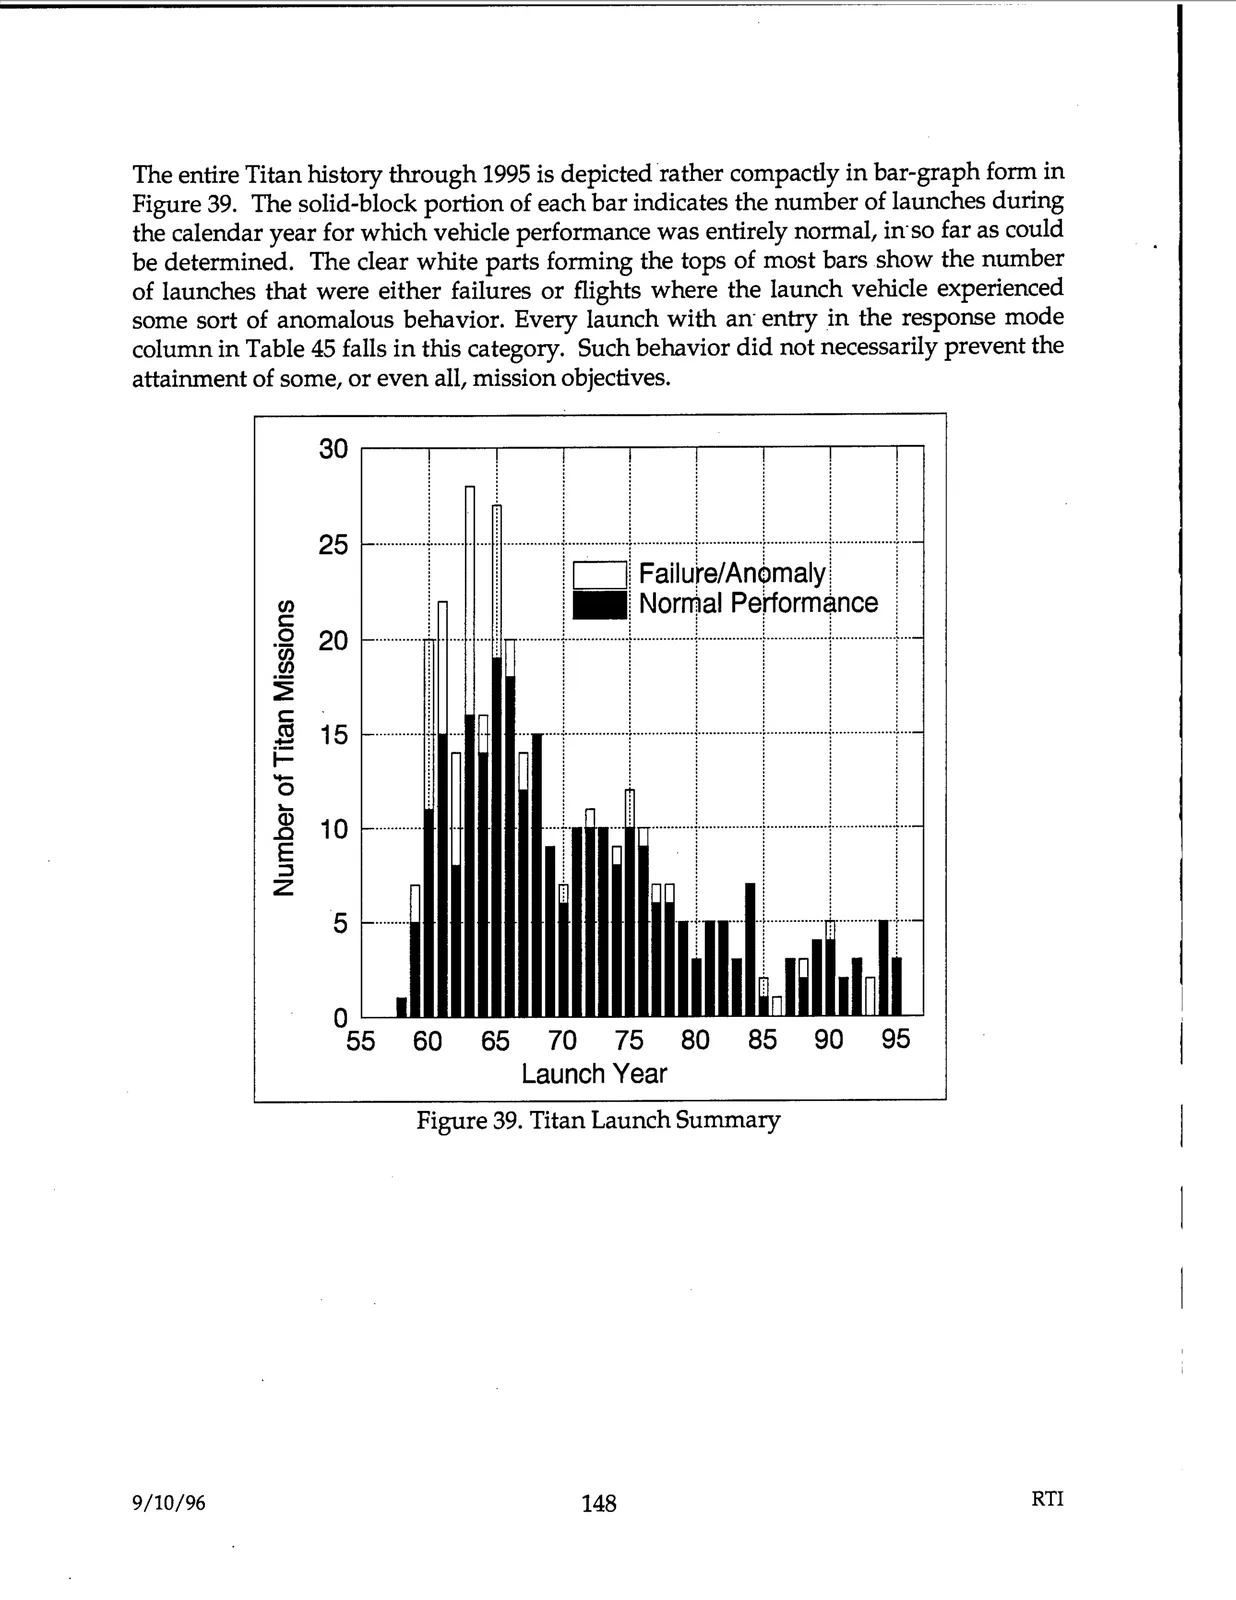
The entire Titan history through 1995 is depicted rather compactly in bar-graph form in
Figure 39. The solid-block portion of each bar indicates the number of launches during
the calendar year for which vehicle performance was entirely normal, in-so far as could
be determined. The clear white parts forming the tops of most bars show the number
of launches that were either failures or flights where the launch vehicle experienced
some sort of anomalous behavior. Every launch with an- entry _in the response mode
column in Table 45 falls in this category. Such behavior did not necessarily prevent the
attainment of some, or even all, mission objectives.
9/10/96
30 ,-------,,-------,,-------,------,----,----,------.-----,---,
!
I
25
~
!
! □i Failu~e/An~maly!
!
~
I
11111 Nor1a1 Perormf nee I
0
20
......................
············································.··································.·················.···
·_ffl_
,
l
i
l
i
l
~
;,:.
!
!
!
!
!
:
:
:
:
:
5
i
l
i
l
i
l
i-_-0~
15
............ i',,;
... ····;····· .... ·······;· ............... ( ............... i ................ ( ............... i .. .
i
!
i
i I
i
.cm 10
I
I
I
I
I
···· 1
...
. .......... ( ................ l ................ f················1 ···
§
!
I
I
I
I
z
:
:
:
:
:
:
:
:
:
:
!
i
i
j
·r
--- ·-r··--········--- = ........... ·-r···
l
i
l
·5
........ .
0 L....-____ ___,..._. ............ ___, ..........
55
60
65
70
75
80
85
90
95
Launch Year
Figure 39. Titan Launch Summary
148
RTI