Department of the Air Force Report, 1996
DOW-UAP-D048 · page 19 of 181
Text
This text came with the file. It may have mistakes. When the text and the image disagree, the image is right.
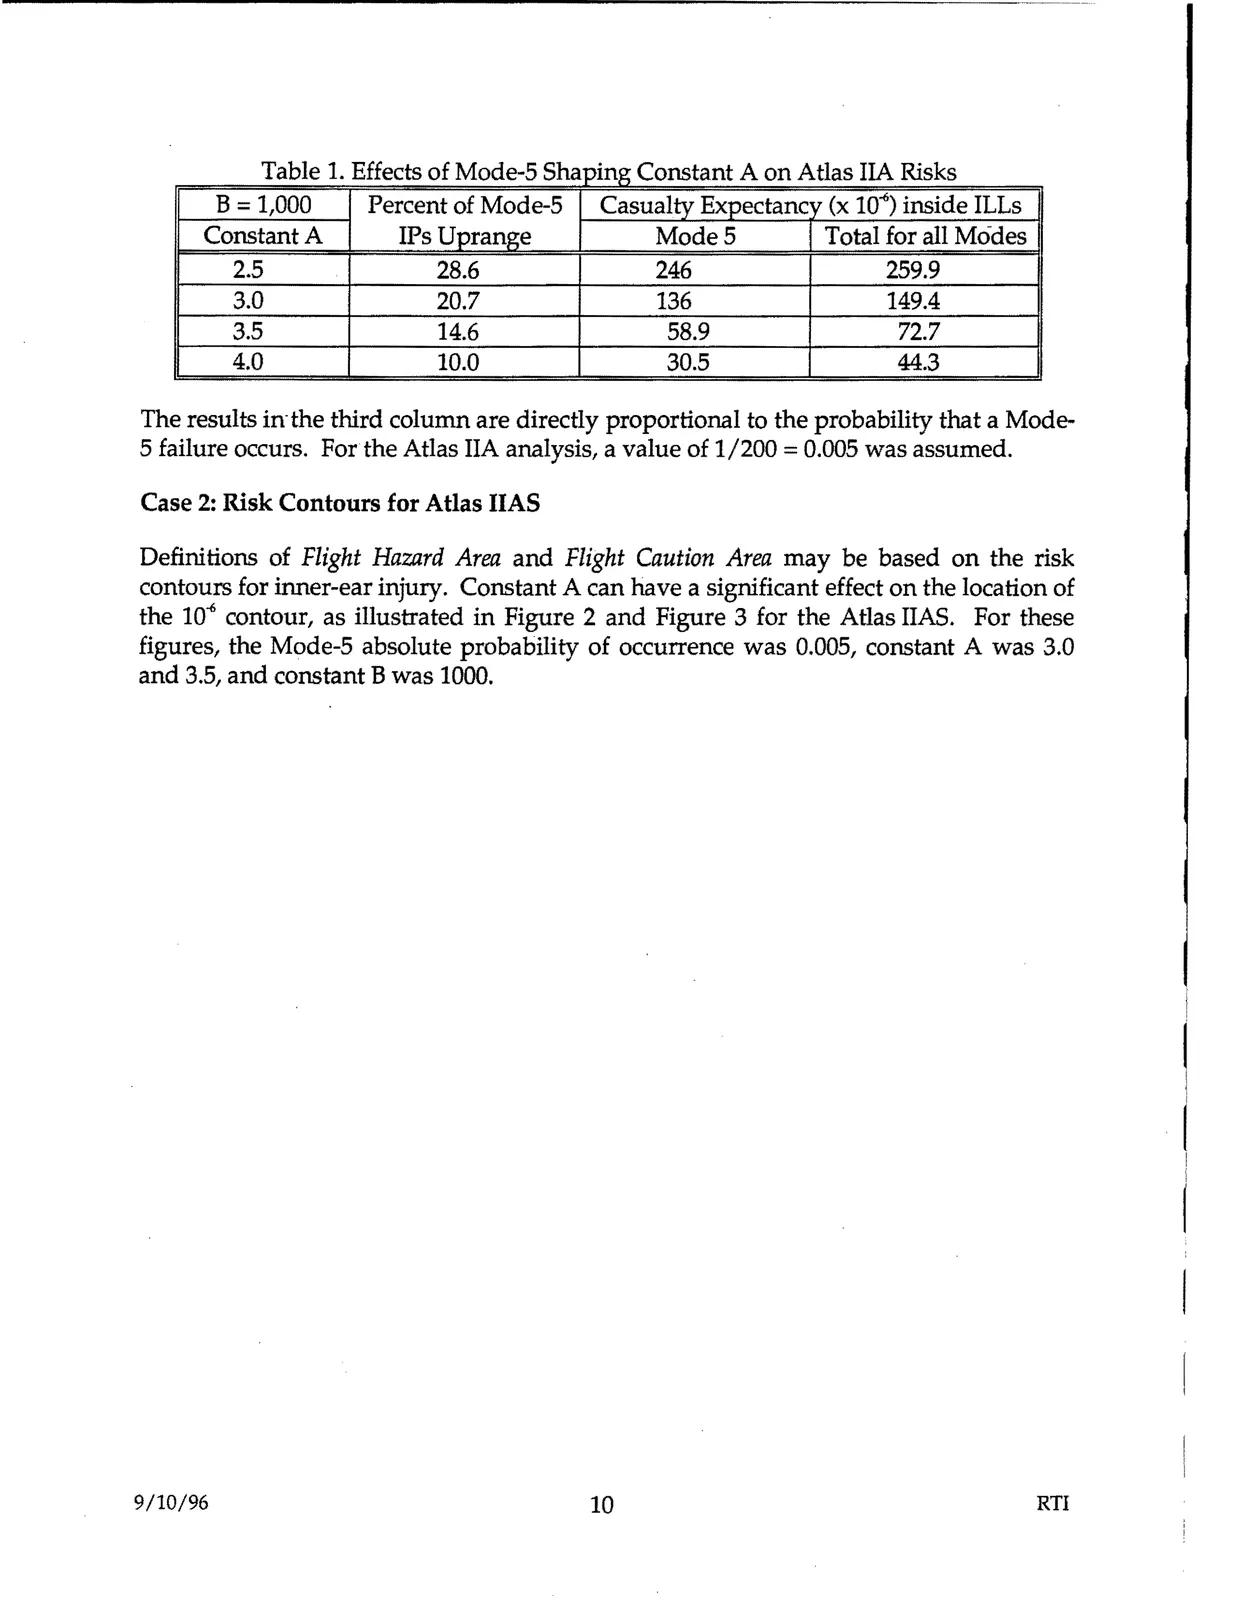
Table 1. Effects of Mode-5 Shaping Constant A on Atlas IIA Risks B= 1,000 Percent of Mode-5 IPs Uprange 28.6 Casualty Expectancv (x 10°') inside ILLs Modes Total for all Modes 246 259.9 Constant A 2.5 3.0 3.5 4.0 20.7 14.6 10.0 136 149.4 58.9 72.7 30.5 44.3 The results in·the third column are directly proportional to the probability that a Mode 5 failure occurs. For the Atlas IIA analysis, a value of 1/200 = 0.005 was assumed. Case 2: Risk Contours for Atlas IIAS Definitions of Flight Hazard Area and Flight Caution Area may be based on the risk contours for inner-ear injury. Constant A can have a significant effect on the location of the 10-6 contour, as illustrated in Figure 2 and Figure 3 for the Atlas IIAS. For these figures, the Mode-5 absolute probability of occurrence was 0.005, constant A was 3.0 and 3.5, and constant B was 1000. 9/10/96 10 RTI