Department of the Air Force Report, 1996
DOW-UAP-D048 · page 62 of 181
Text
A machine read this text from the scan. When the text and the image disagree, the image is right.
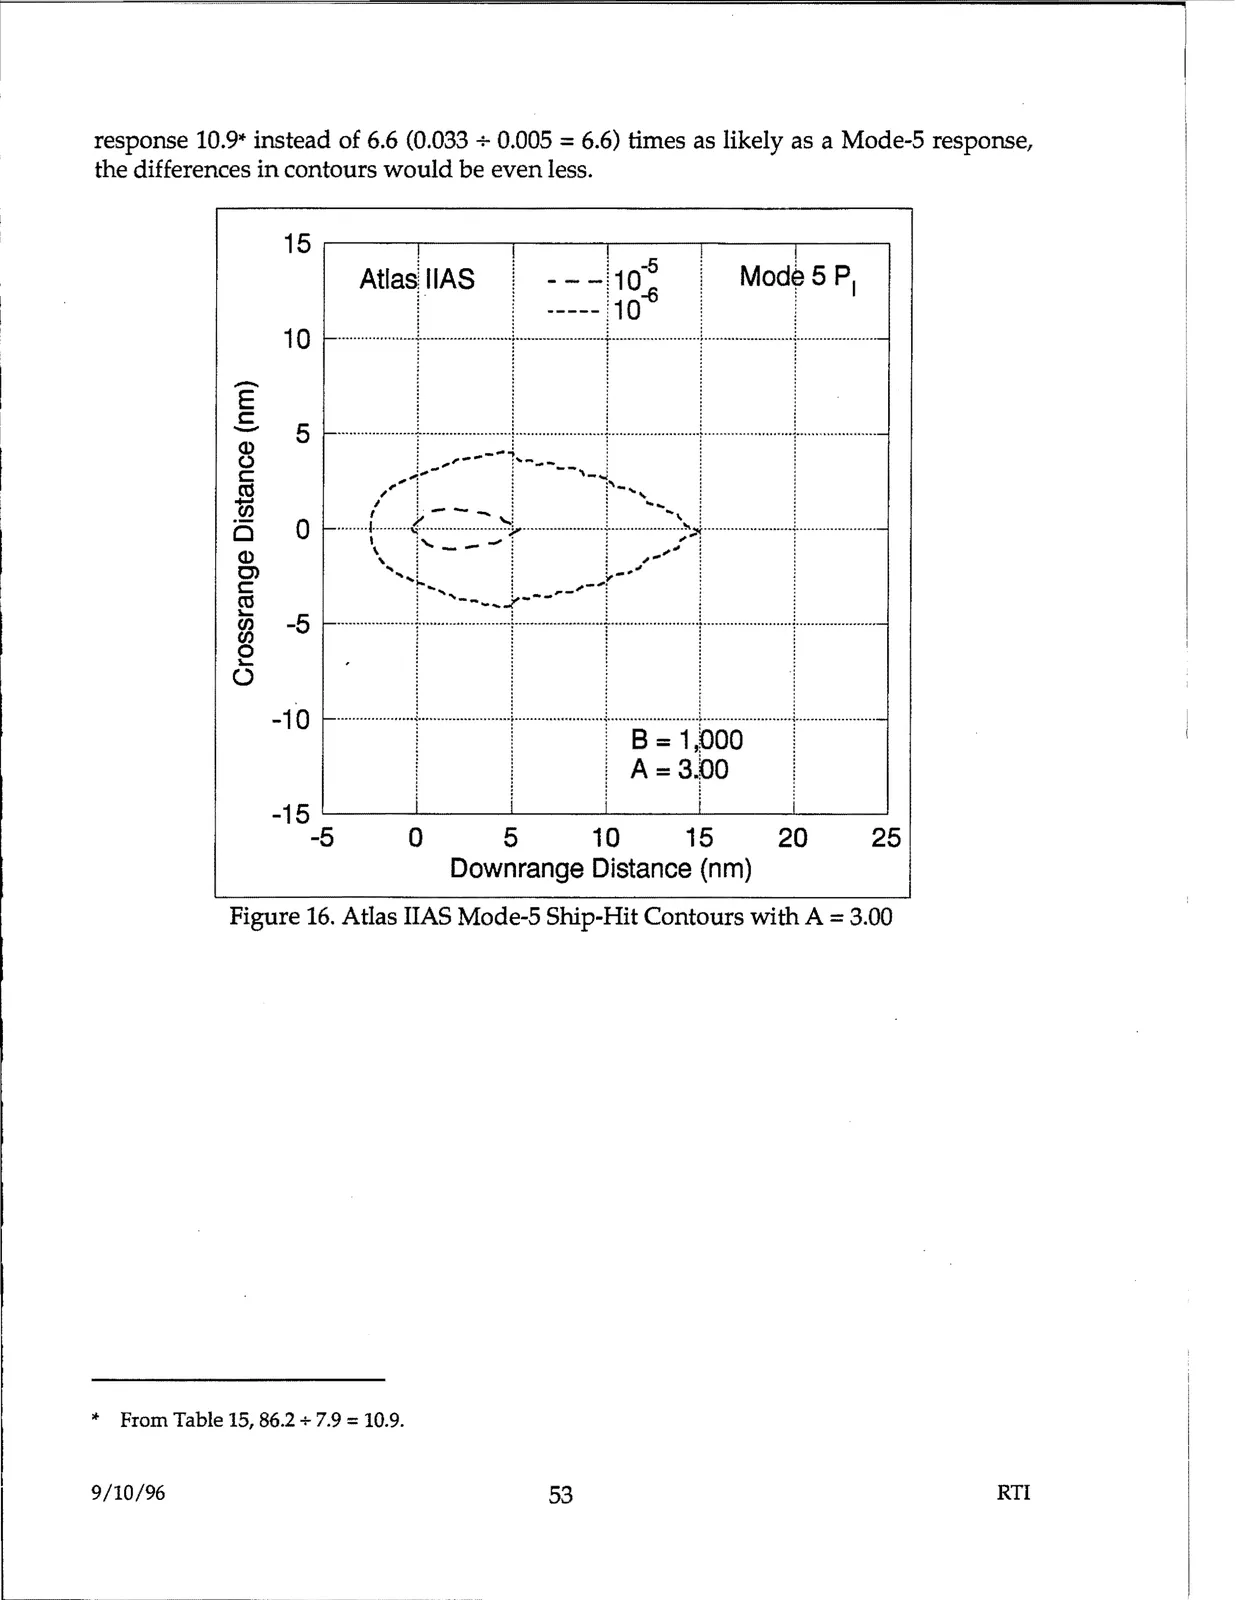
response 10.9* instead of 6.6 (0.033 ÷ 0.005 = 6.6) times as likely as a Mode-5 response, the differences in contours would be even less.

Figure 16. Atlas IIAS Mode-5 Ship-Hit Contours with A = 3.00

* From Table 15, 86.2 ÷ 7.9 = 10.9.

9/10/96

53

RTI