Department of the Air Force Report, 1996
DOW-UAP-D048 · page 7 of 181
Text
This text came with the file. It may have mistakes. When the text and the image disagree, the image is right.
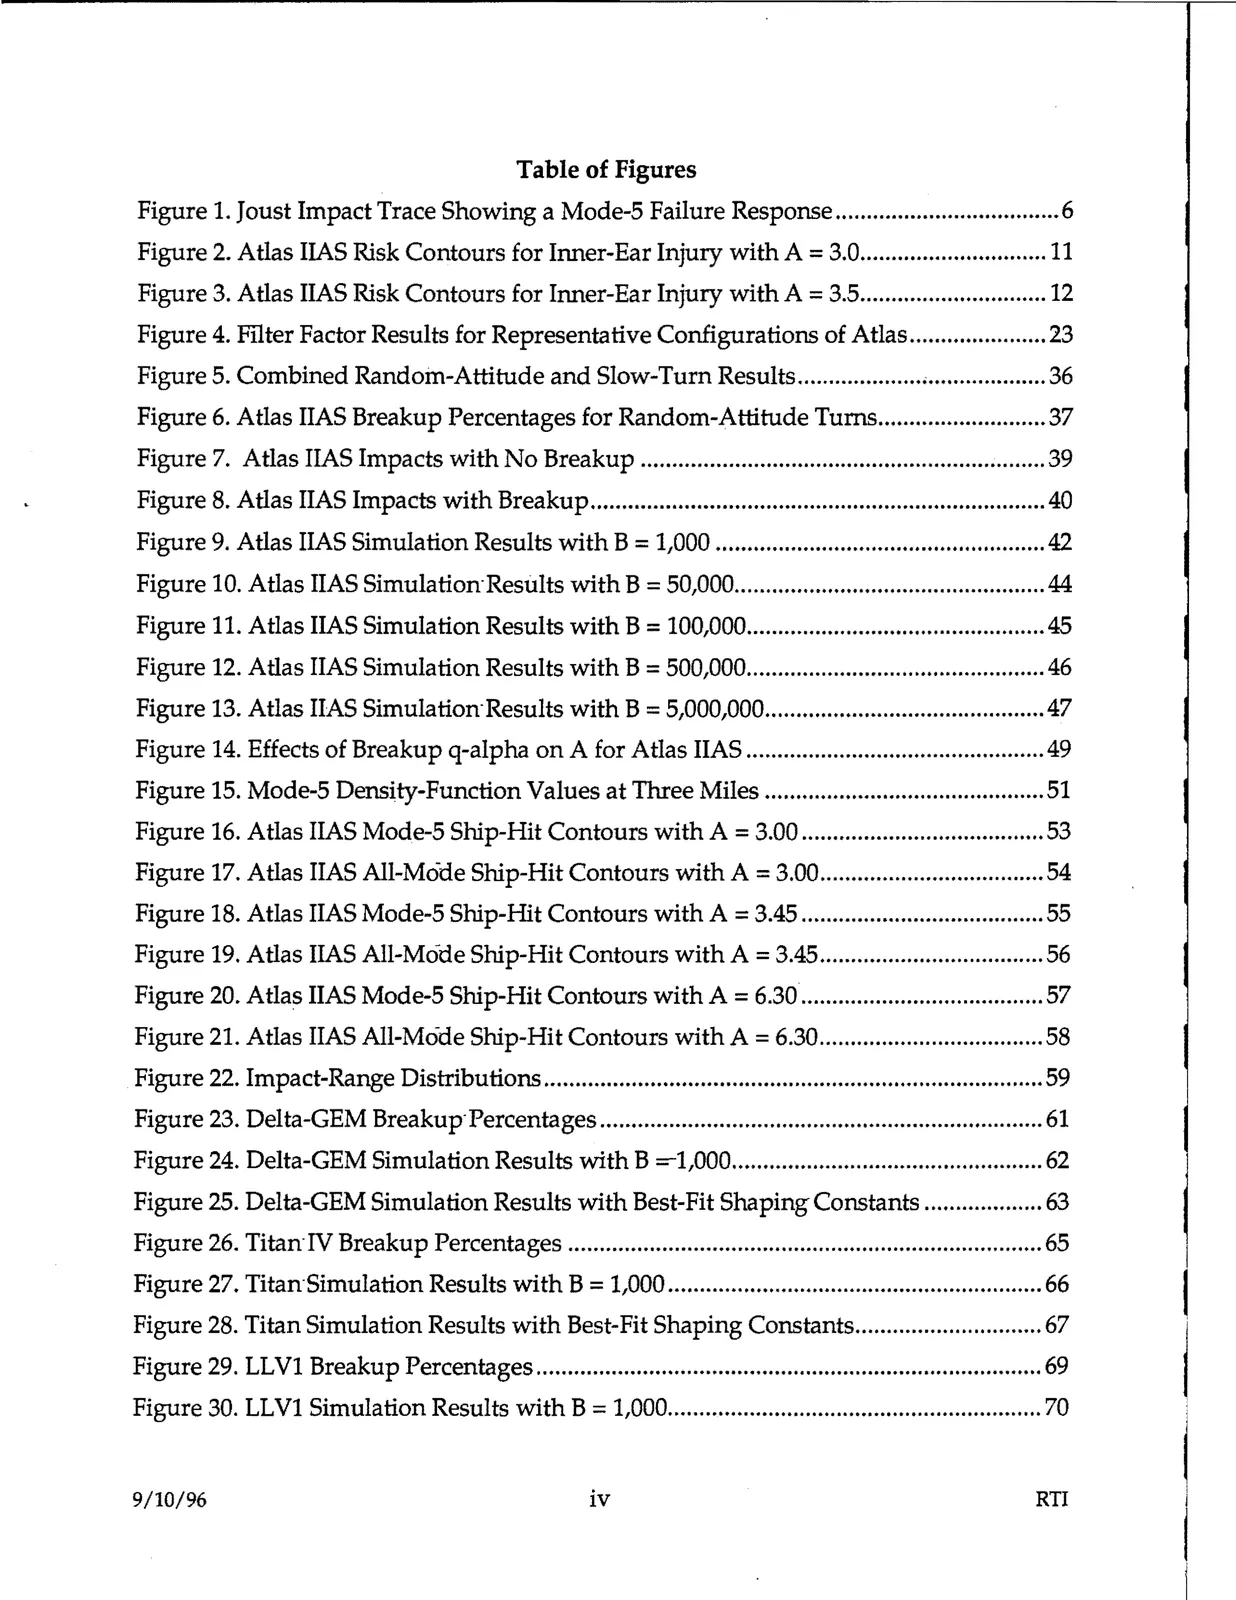
Table of Figures
Figure 1. Joust Impact Trace Showing a Mode-5 Failure Response ....................................6
Figure 2. Atlas IIAS Risk Contours for Inner-Ear Injury with A = 3.0.............................. 11
Figure 3. Atlas IIAS Risk Contours for Inner-Ear Injury with A = 3.5.............................. 12
Figure 4. Filter Factor Results for Representative Configurations of Atlas ...................... 23
Figure 5. Combined Random-Attitude and Slow-Tum Results ........................................ 36
Figure 6. Atlas IIAS Breakup Percentages for Random-Attitude Tums ........................... 37
Figure 7. Atlas HAS Impacts with No Breakup ........................................................ ~ ........ 39
Figure 8. Atlas IIAS Impacts with Breakup ......................................................................... 40
Figure 9. Atlas IIAS Simulation Results with B = 1,000 ..................................................... 42
Figure 10. Atlas IIAS Simulation Results with B = 50,000.................................................. 44
Figure 11. Atlas HAS Simulation Results with B = 100,000................................................ 45
Figure 12. Atlas HAS Simulation Results with B = 500,000................................................ 46
Figure 13. Atlas HAS Simulation·Results with B = 5,000,000.............................................47
Figure 14. Effects of Breakup q-alpha on A for Atlas IIAS ................................................ 49
Figure 15. Mode-5 Density-Function Values at Three Miles ............................................. 51
Figure 16. Atlas IIAS Mode-5 Ship-Hit Contours with A= 3.00 ....................................... 53
Figure 17. Atlas IIAS All-Mode Ship-Hit Contours with A = 3.00.................................... 54
Figure 18. Atlas IIAS Mode-5 Ship-Hit Contours with A= 3.45 .......................................55
Figure 19. Atlas IIAS All-Mode Ship-Hit Contours with A= 3.45.................................... 56
Figure 20. Atlas IIAS Mode-5 Ship-Hit Contours with A = 6.30 ....................................... 57
Figure 21. Atlas IIAS All-Mode Ship-Hit Contours with A = 6.30.................................... 58
Figure 22. Impact-Range Distributions .................................................................................. 59
Figure 23. Delta-GEM Breakup· Percentages ....................................................................... 61
Figure 24. Delta-GEM Simulation Results with B ==-1,000.................................................. 62
Figure 25. Delta-GEM Simulation Results with Best-Fit Shaping Constants ................... 63
Figure 26. Titctn·IV Breakup Percentages ................................................................................ 65
Figure 27. Titan·Simulation Results with B = 1,000 ............................................................ 66
Figure 28. Titan Simulation Results with Best-Fit Shaping Constants .............................. 67
Figure 29. LLVl Breakup Percentages ..................................................................................................................... 69
Figure 30. LLVl Simulation Results with B = l,000............................................................ 70
iv
RTI
9/10/96