AAWSAP DIRD, Inertial Electrostatic Confinement Fusion, March 2010
DOW-UAP-D125 · page 44 of 72
Text
This text came with the file. It may have mistakes. When the text and the image disagree, the image is right.
UNCLASSIFIED/ /POI\ OPPICllct tt!I!! 9HLY
Q
Q
8
6
2
Q
Q
rel
fdl
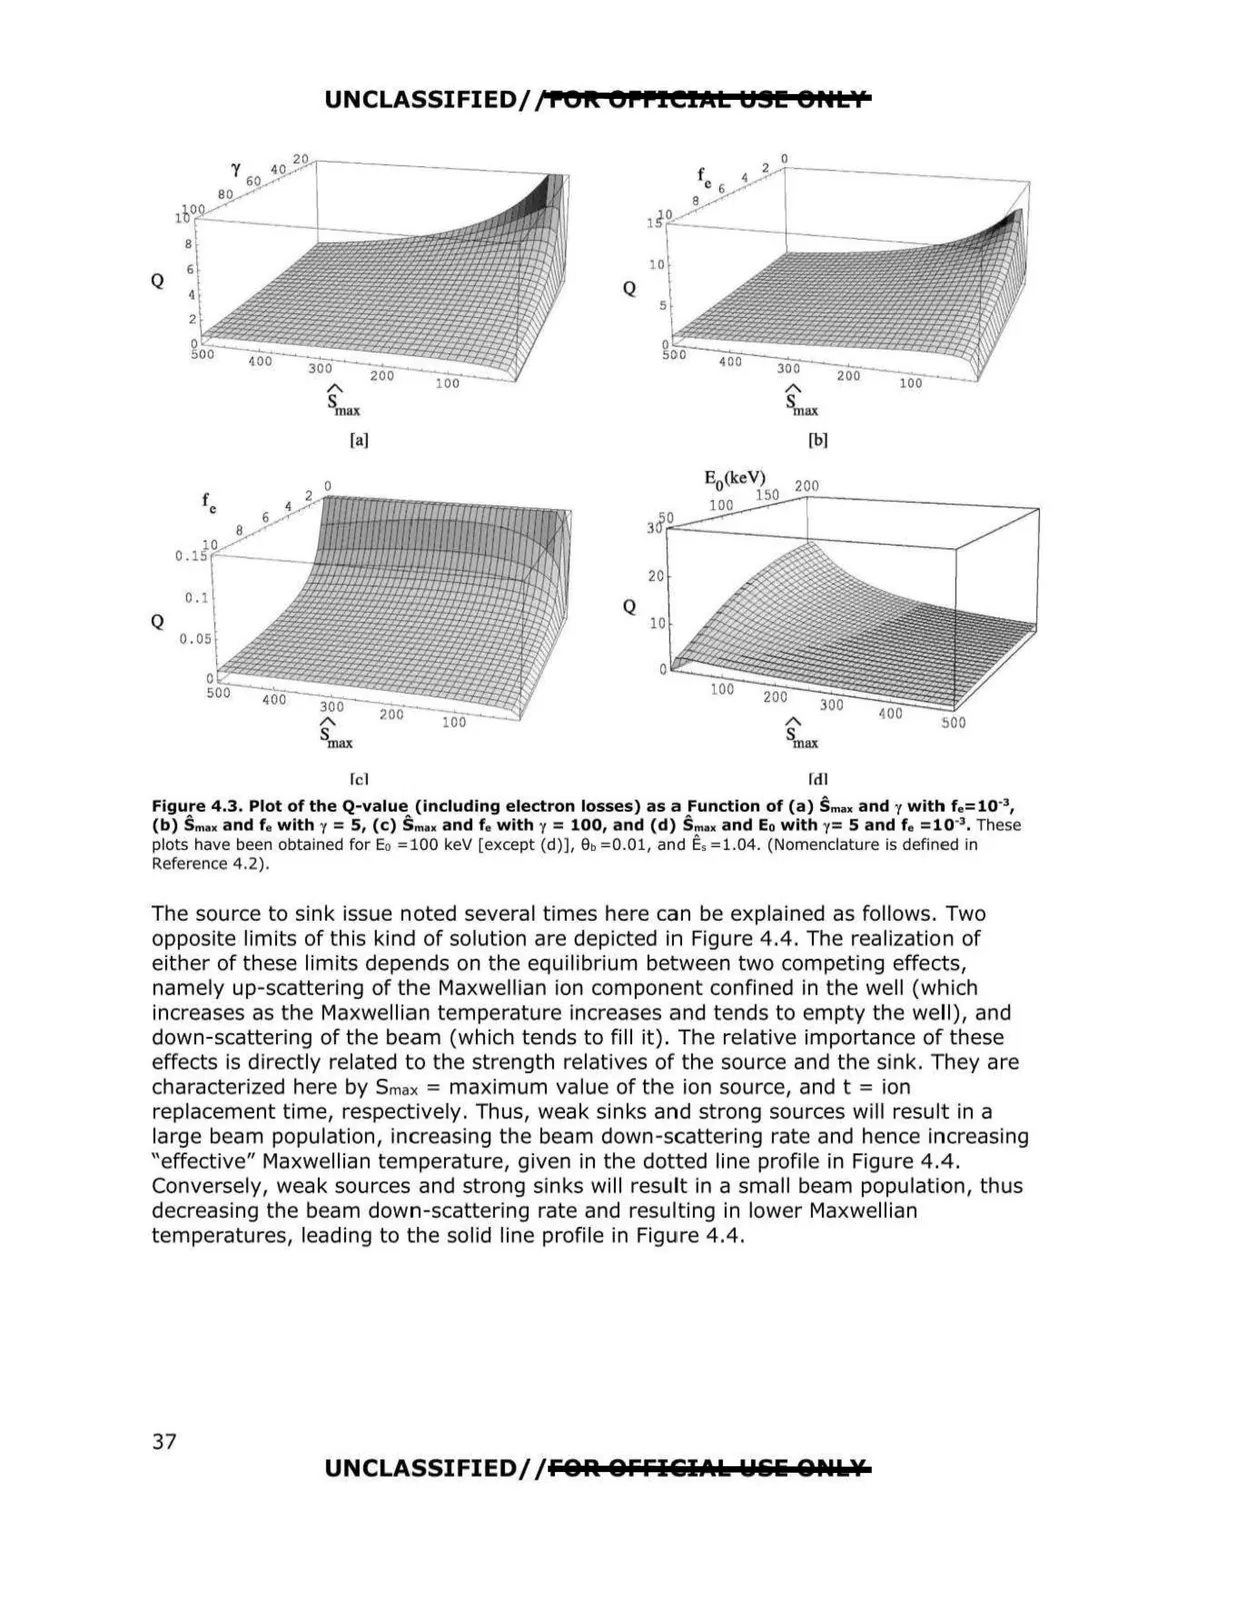
Figure 4.3. Plot of the Q-value (including electron losses) as a Function of (a) Smax and y with f.= 10·3,
(b) Smax and f a with y = 5, (c) Smu and f o with y = 100, and (d) Smax and Eo with y= 5 and f o =10"3, These
plots have been obtained for Eo = 100 keV [except (d)], 9b = 0.01, and E, = 1.04. (Nomenclature is defined in
Reference 4.2).
The source to sink issue noted several times here can be explained as follows. Two
opposite limits of this kind of solution are depicted in Figure 4.4. The realization of
either of these limits depends on the equilibrium between two competing effects,
namely up-scattering of the Maxwellian ion component confined in the well (which
increases as the Maxwellian temperature increases and tends to empty the well), and
down-scattering of the beam (which tends to fill it). The relative importance of these
effects is directly related to the strength relatives of the source and the sink. They are
characterized here by S max = maximum value of the ion source, and t = ion
replacement time, respectively . Thus, weak sinks and strong sources will result in a
large beam population, increasing the beam down-scattering rate and hence increasing
"effective" Maxwellian temperature, given in the dotted line profile in Figure 4.4.
Conversely, weak sources and strong sinks will result in a small beam population, thus
decreasing the beam down-scattering rate and resu lting in lower Maxwellian
temperatures, leading to the solid line profile in Figure 4.4.
UNCLASSIFIED/ /FOR OFFI&iIAk Wli& &ill'U,¥
37