AAWSAP DIRD, An Introduction to the Statistical Drake Equation, March 2010
DOW-UAP-D127 · page 12 of 55
Text
This text came with the file. It may have mistakes. When the text and the image disagree, the image is right.
UNCLASSIFIED//fOR OFFI&IAk Wlii QPU,¥
Having so done, the next question is:
How can we find out the PROBABILITY DISTRIBUTION for each D; ?
For instance, shall that be a Gaussian, or what?
This is a difficult question, for nobody knows, for instance, the probability distribution of
the number of stars in the galaxy, not to mention the probability distribution of the
other six variables in the Drake equation (7).
There is a brilliant way to get around this difficulty, though.
We start by excluding the Gaussian because each variable in the Drake equation is a
POSITIVE (or, more precisely, a non-negative) random variable, while the Gaussian
applies to REAL random variables only. So, the Gaussian is out. Then, one might
consider the large class of well-studied and positive probability densities called "the
gamma distributions," but it is then unclear why one should adopt the gamma
distributions and not any other. The solution to this apparent conundrum comes from
Shannon's Information Theory and a theorem that he proved in 1948: "The probability
distribution having maximum entropy ( = uncertainty) over any FINITE range of real
values is the UNIFORM distribution over that range," This is proven in Appendix A of the
present document.
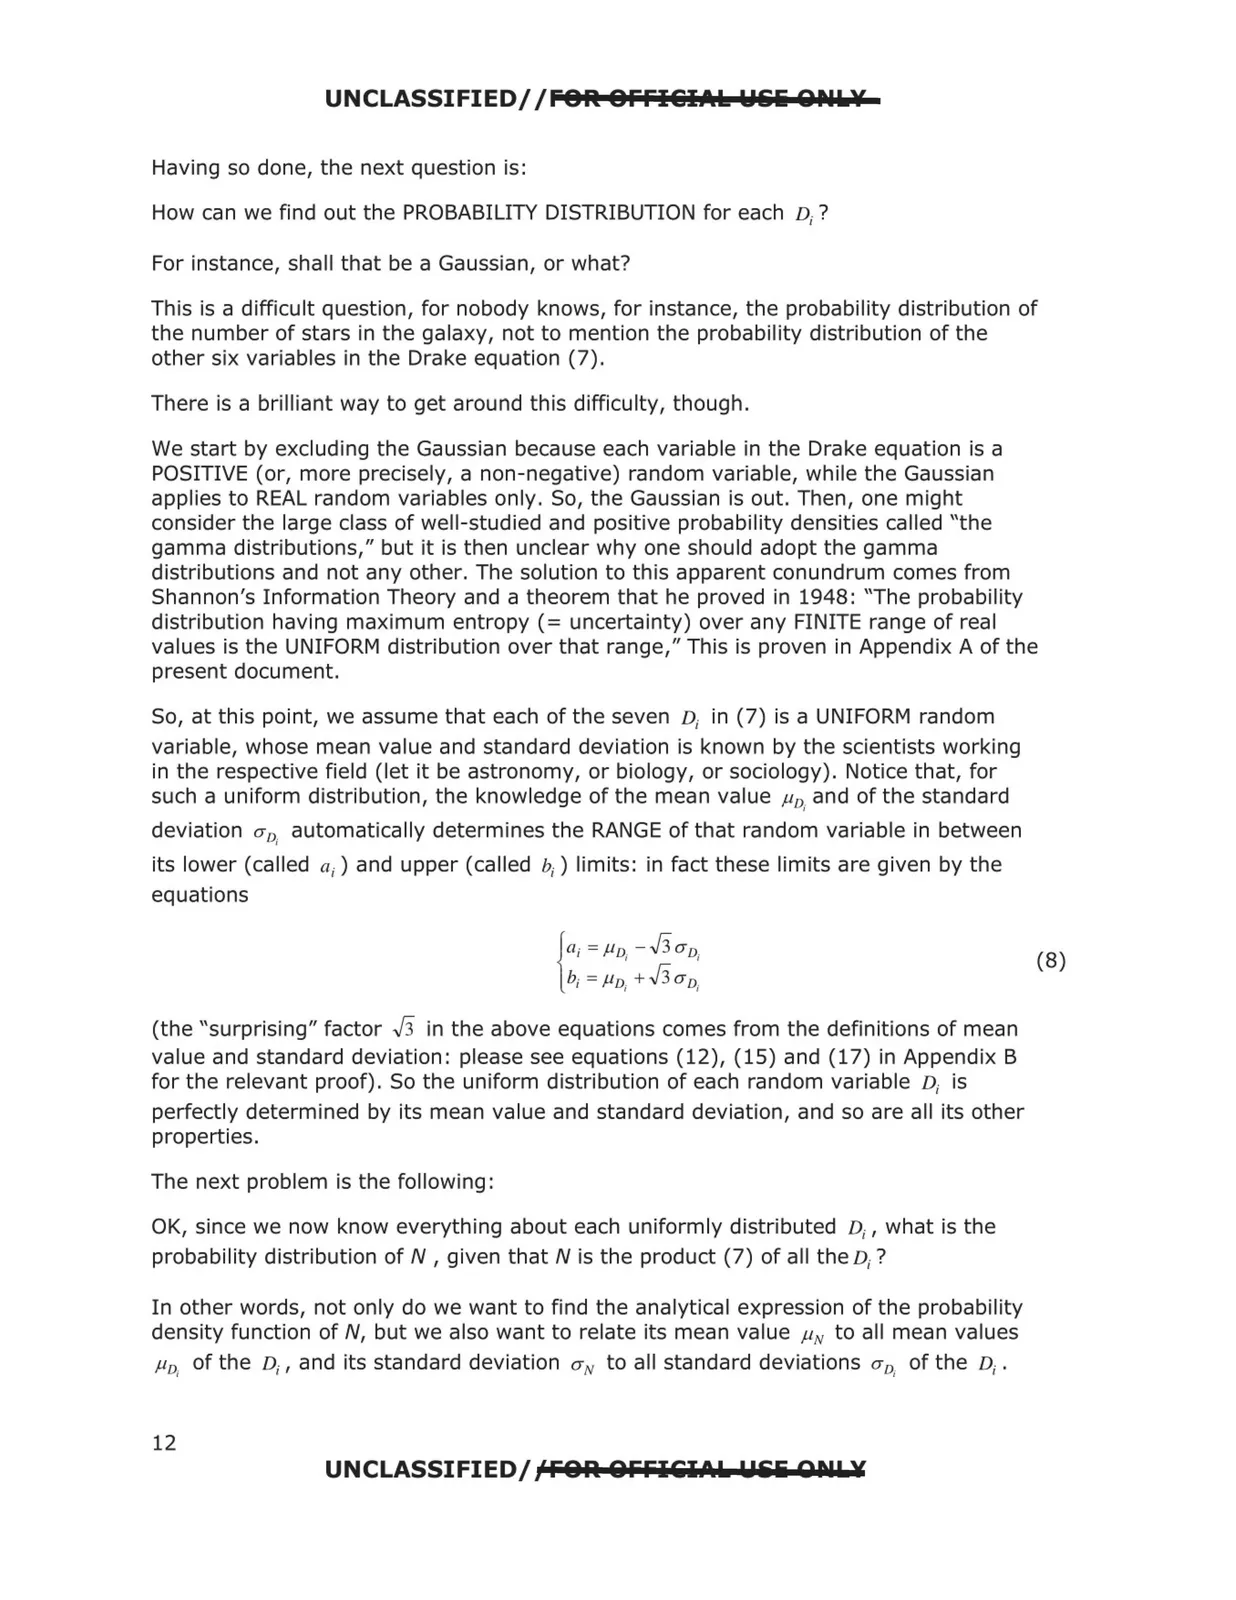
So, at this point, we assume that each of the seven D; in (7) is a UNIFORM random
variable, whose mean value and standard deviation is known by the scientists working
in the respective field (let it be astronomy, or biology, or sociology). Notice that, for
such a uniform distribution, the knowledge of the mean value Po; and of the standard
deviation u 0, automatically determines the RANGE of that random variable in between
its lower (called a;) and upper (called b;) limits: in fact these limits are given by the
equations
(8)
(the "surprising" factor ✓3 in the above equations comes from the definitions of mean
value and standard deviation: please see equations (12), (15) and (17) in Appendix B
for the relevant proof). So the uniform distribution of each random variable D; is
perfectly determined by its mean value and standard deviation, and so are all its other
properties.
The next problem is the following:
OK, since we now know everything about each uniformly distributed D;, what is the
probability distribution of N, given that N is the product (7) of all the D1?
In other words, not only do we want to find the analytical expression of the probability
density function of N, but we also want to relate its mean value f-lN to all mean values
µ
of the D;, and its standard deviation
to all standard deviations
of the D;.
,
u
N
u
,
0
0
12
UNCLASSIFIED/ fFOR: QFFICiIO L. lalii ODIL.¥