AAWSAP DIRD, Ultracapacitors as Energy and Power Storage Devices, November 2010
DOW-UAP-D147 · page 28 of 34
Text
A machine read this text from the scan. When the text and the image disagree, the image is right.
UNCLASSIFIED//FOR OFFICIAL USE ONLY

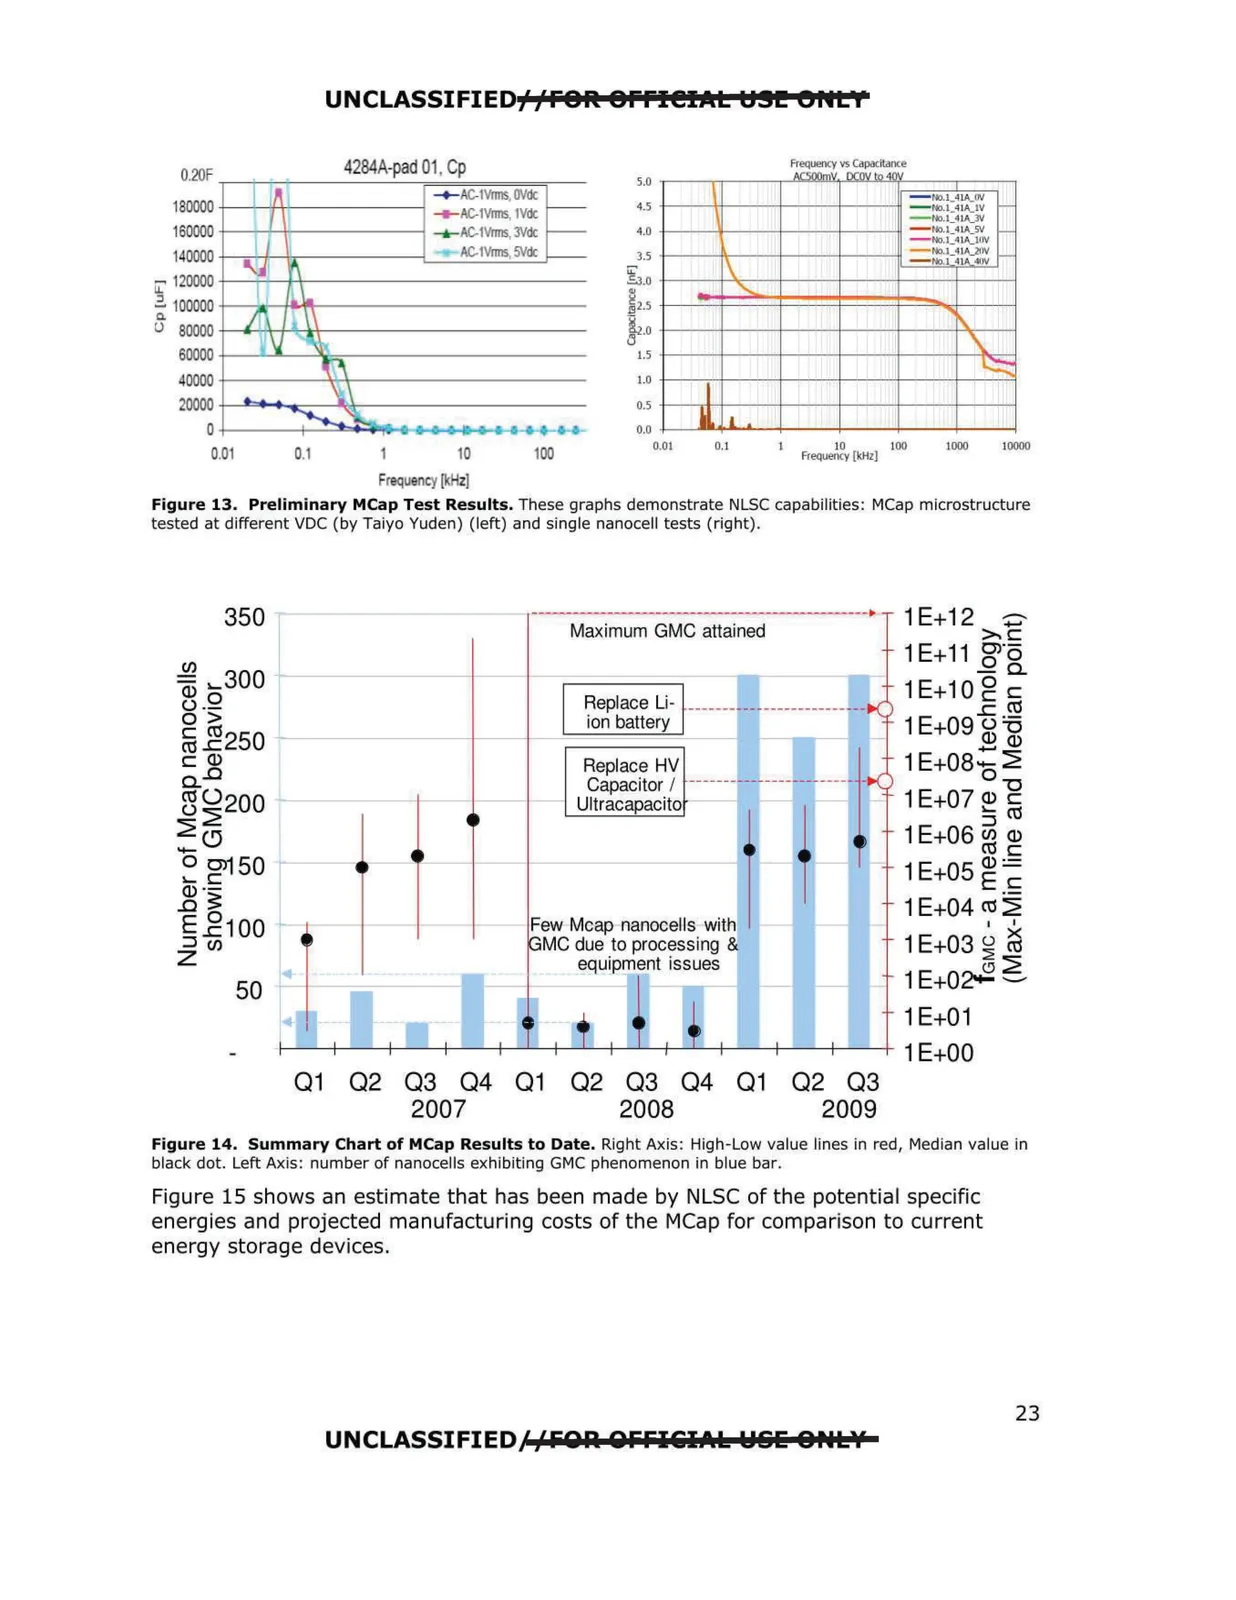
Figure 13. Preliminary MCap Test Results. These graphs demonstrate NLSC capabilities: MCap microstructure tested at different VDC (by Taiyo Yuden) (left) and single nanocell tests (right).

Figure 14. Summary Chart of MCap Results to Date. Right Axis: High-Low value lines in red, Median value in black dot. Left Axis: number of nanocells exhibiting GMC phenomenon in blue bar.

Figure 15 shows an estimate that has been made by NLSC of the potential specific energies and projected manufacturing costs of the MCap for comparison to current energy storage devices.

23

UNCLASSIFIED//FOR OFFICIAL USE ONLY