AAWSAP DIRD, Quantum Tomography of Negative Energy States in the Vacuum, January 2011
DOW-UAP-D153 · page 39 of 51
Text
This text came with the file. It may have mistakes. When the text and the image disagree, the image is right.
UNCLASSIFIED//FOR &FFl&IAk l:ISE &HkV
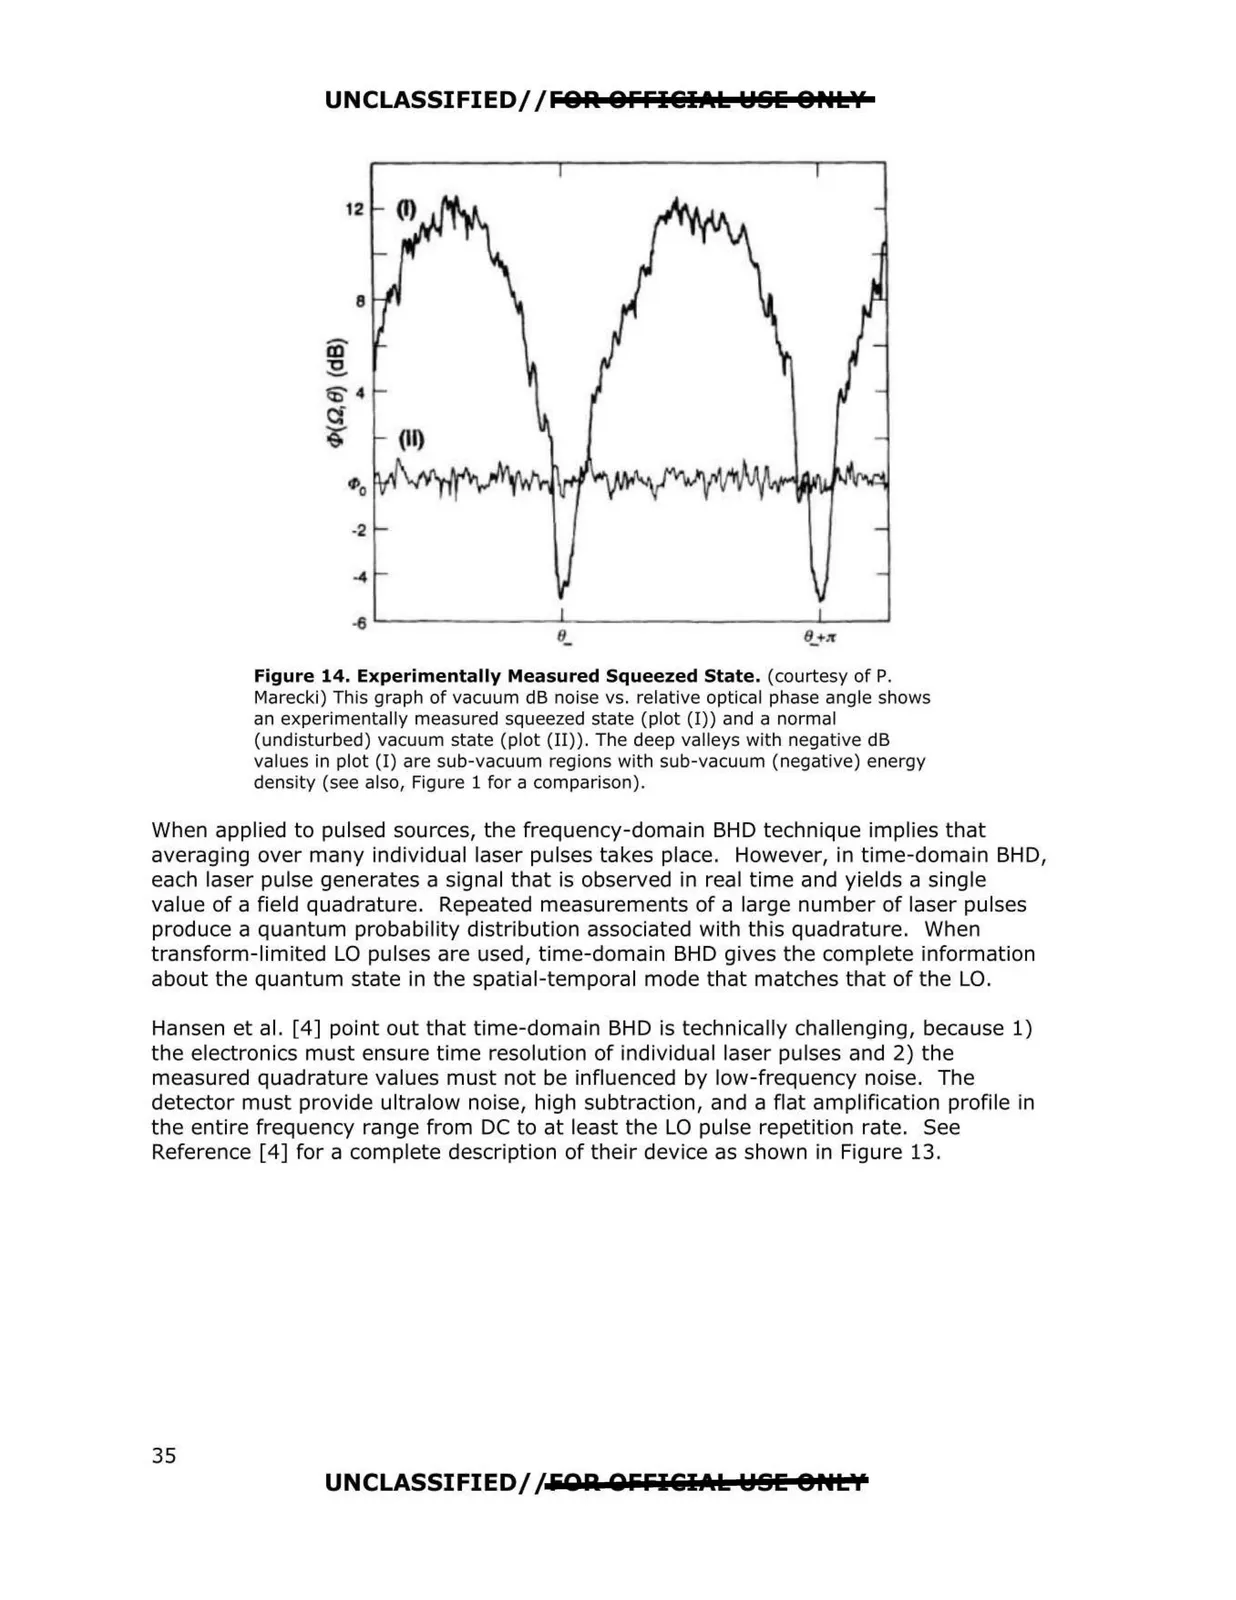
Figure 14. Experimentally Measured Squeezed State. (courtesy of P.
Marecki) This graph of vacuum dB noise vs. relative optical phase angle shows
an experimentally measured squeezed state (plot (I)) and a normal
(undisturbed) vacuum state (plot (II)). The deep valleys with negative dB
values in plot (I) are sub-vacuum regions with sub-vacuum (negative) energy
density (see also, Figure 1 for a comparison).
When applied to pulsed sources, the frequency-domain BHD technique implies that
averaging over many individual laser pulses takes place. However, in time-domain BHD,
each laser pulse generates a signal that is observed in real time and yields a single
value of a field quadrature. Repeated measurements of a large number of laser pulses
produce a quantum probability distribution associated with this quadrature. When
transform-limited LO pulses are used, time-domain BHD gives the complete information
about the quantum state in the spatial-temporal mode that matches that of the LO.
Hansen et al. [4] point out that time-domain BHD is technically challenging, because 1)
the electronics must ensure time resolution of individual laser pulses and 2) the
measured quadrature values must not be influenced by low-frequency noise. The
detector must provide ultralow noise, high subtraction, and a flat amplification profile in
the entire frequency range from DC to at least the LO pulse repetition rate. See
Reference [4] for a complete description of their device as shown in Figure 13.
UNCLASSIFIED//EOA OFFIGIAk l:ISE 8HLY
35