AAWSAP DIRD, Quantum Tomography of Negative Energy States in the Vacuum, January 2011
DOW-UAP-D153 · page 4 of 51
Text
This text came with the file. It may have mistakes. When the text and the image disagree, the image is right.
UNCLASSIFIED//FOA QFFI@IAL l:l!H! 9HLY
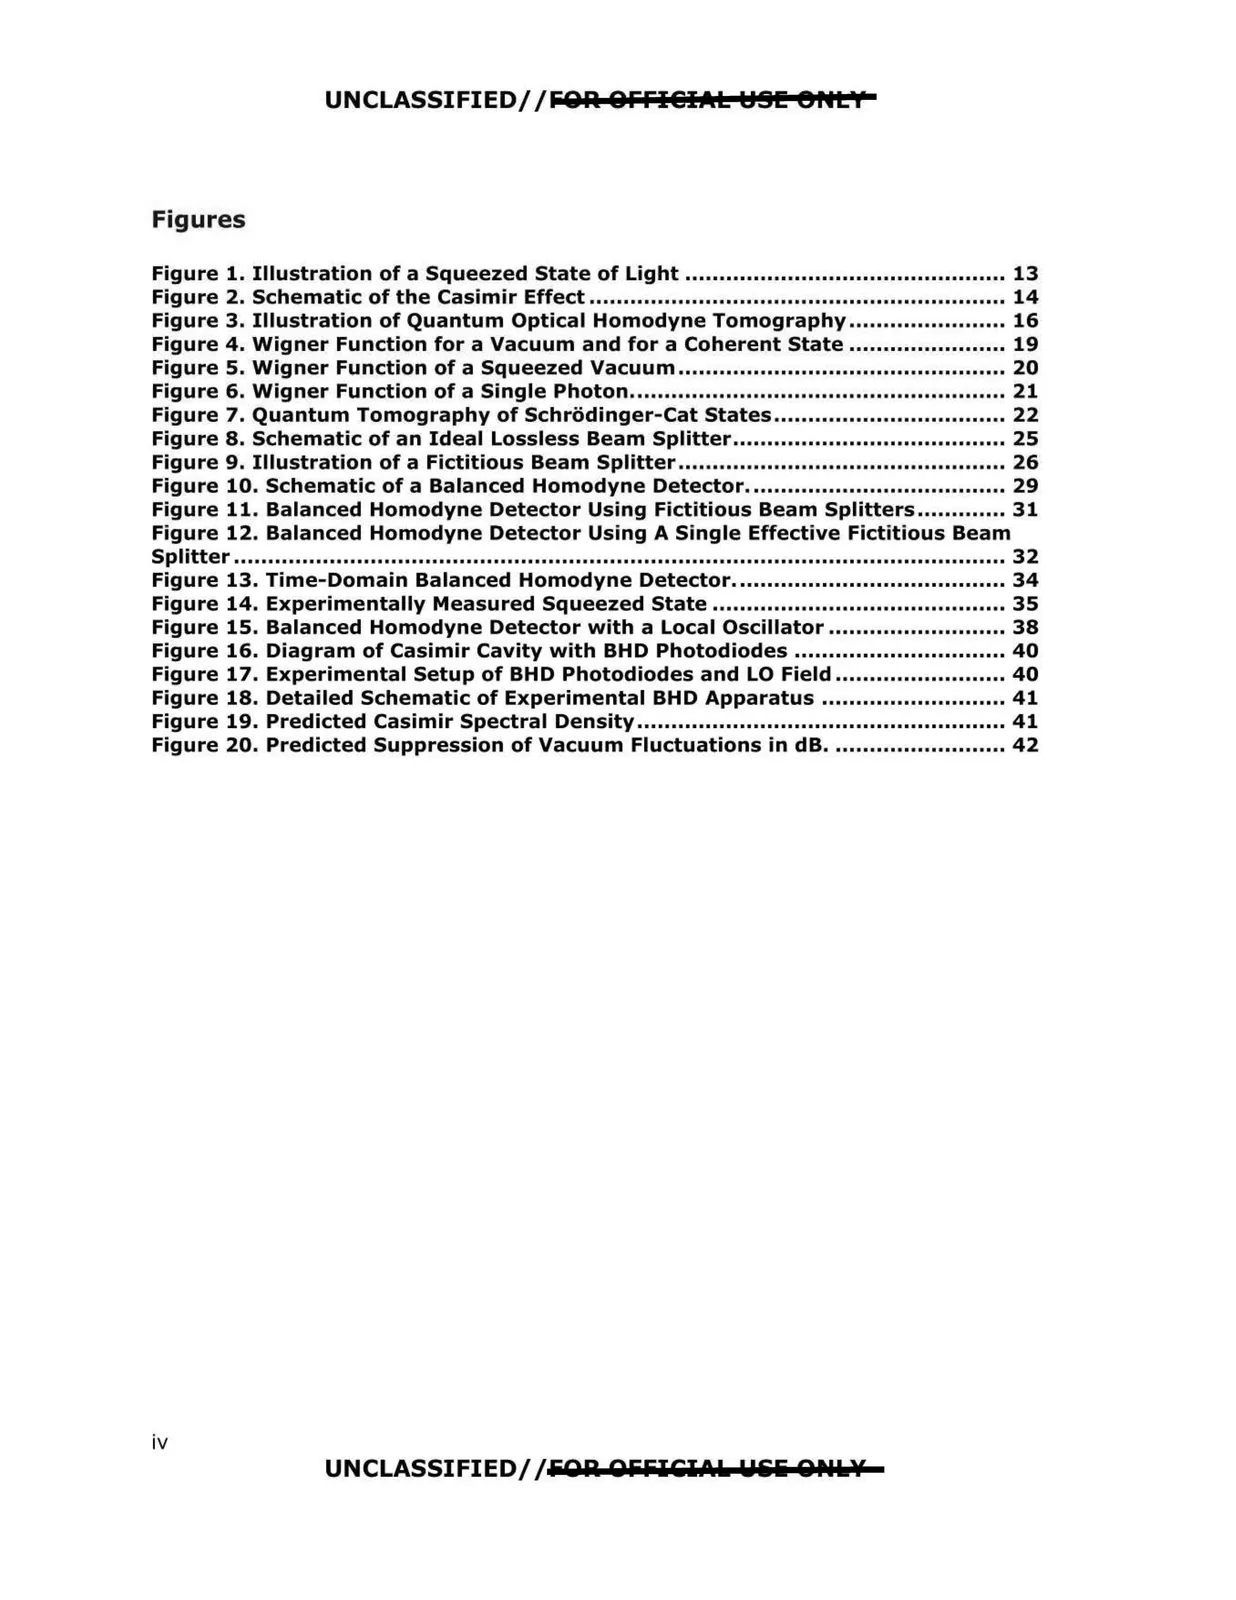
Figures
Figure 1. Illustration of a Squeezed State of Light ............................................... 13
Figure 2. Schematic of the Casimir Effect ............................................................. 14
Figure 3. Illustration of Quantum Optical Homodyne Tomography ....................... 16
Figure 4. Wigner Function for a Vacuum and for a Coherent State ....................... 19
Figure 5. Wigner Function of a Squeezed Vacuum ................................................ 20
Figure 6. Wigner Function of a Single Photon....................................................... 21
Figure 7. Quantum Tomography of Schrodinger-Cat States .................................. 22
Figure 8. Schematic of an Ideal Lossless Beam Splitter........................................ 25
Figure 9. Illustration of a Fictitious Beam Splitter ................................................ 26
Figure 10. Schematic of a Balanced Homodyne Detector...................................... 29
Figure 11. Balanced Homodyne Detector Using Fictitious Beam Splitters ............. 31
Figure 12. Balanced Homodyne Detector Using A Single Effective Fictitious Beam
Splitter ................................................................................................................. 32
Figure 13. Time-Domain Balanced Homodyne Detector........................................ 34
Figure 14. Experimentally Measured Squeezed State ........................................... 35
Figure 15. Balanced Homodyne Detector with a Local Oscillator .......................... 38
Figure 16. Diagram of Casimir Cavity with BHD Photodiodes ............................... 40
Figure 17. Experimental Setup of BHD Photodiodes and LO Field ......................... 40
Figure 18. Detailed Schematic of Experimental BHD Apparatus ........................... 41
Figure 19. Predicted Casimir Spectral Density...................................................... 41
Figure 20. Predicted Suppression of Vacuum Fluctuations in dB.......................... 42
UNCLASSIFIED//EOR OEEICl.1.1. Uiliii ONI.¥
iv