AAWSAP DIRD, Quantum Tomography of Negative Energy States in the Vacuum, January 2011
DOW-UAP-D153 · page 44 of 51
Text
This text came with the file. It may have mistakes. When the text and the image disagree, the image is right.
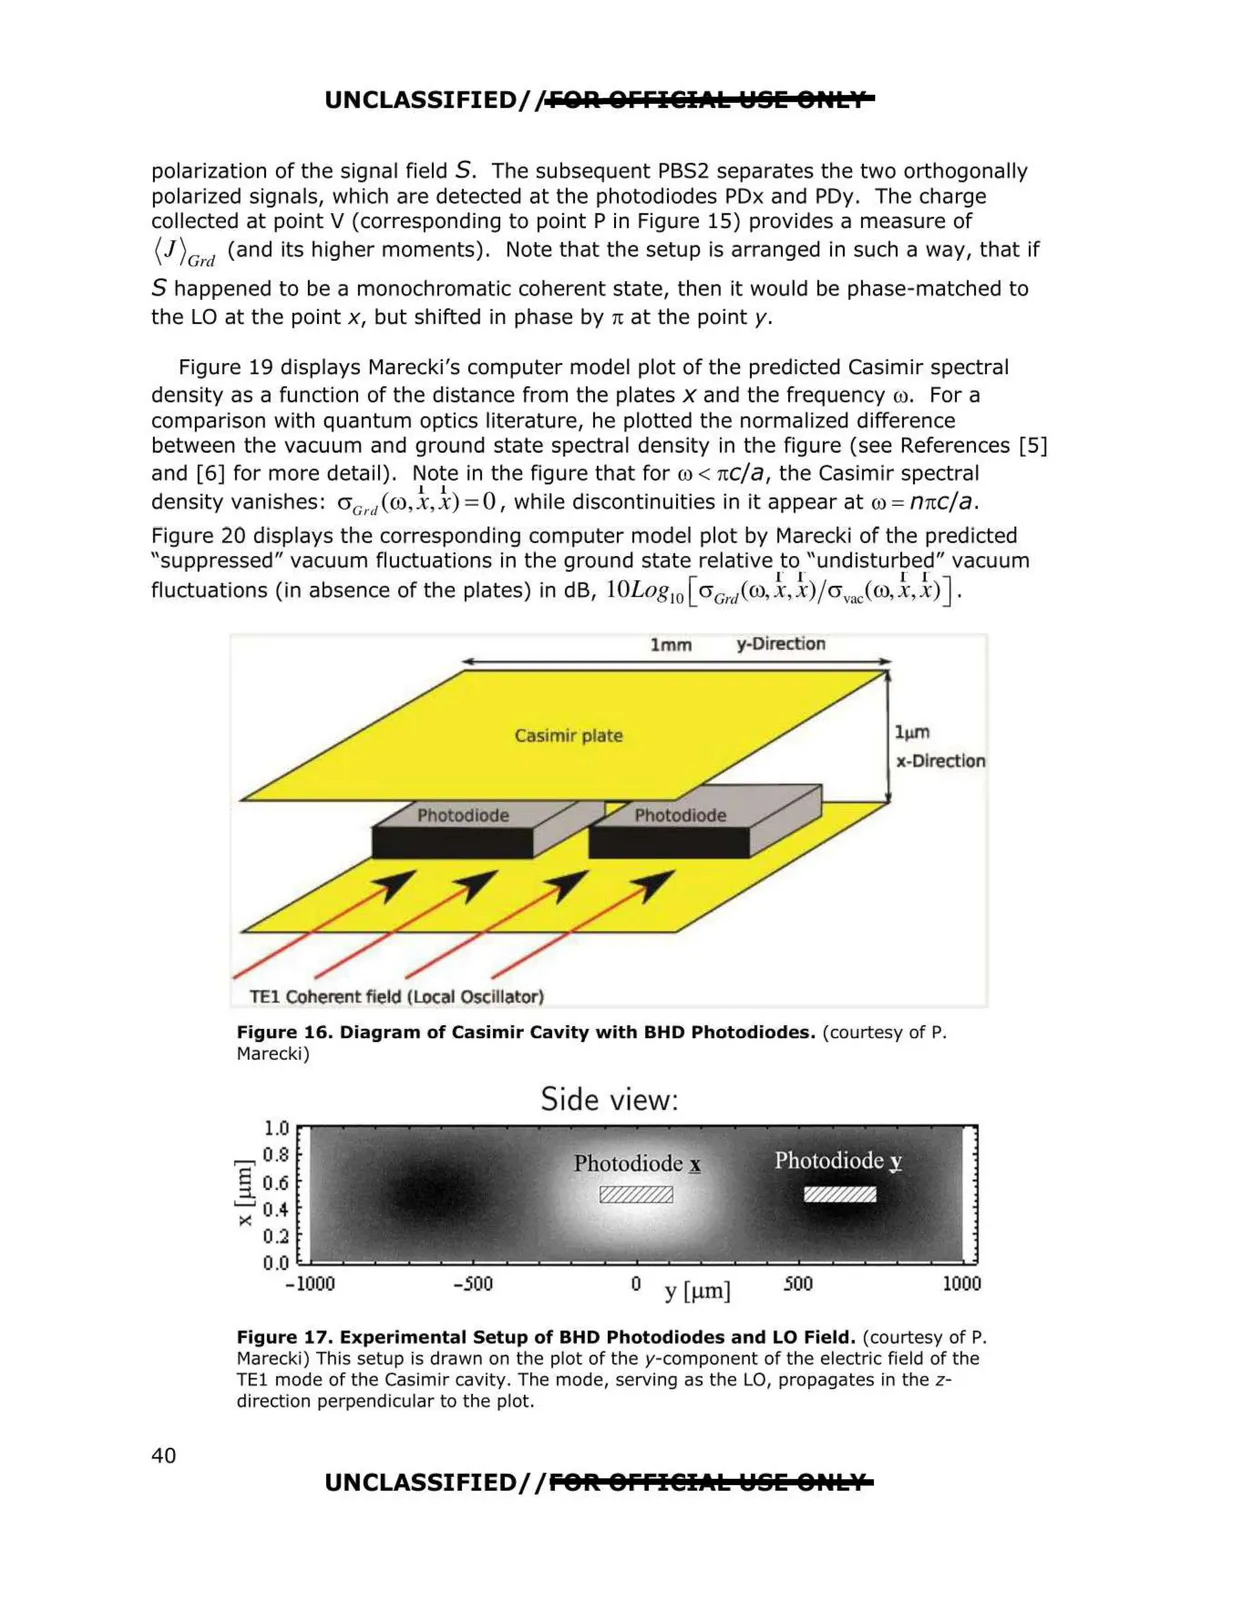
UNCLASSIFIED//FOA QFFI€i1Al l::ISIE 8HLY polarization of the signal field S. The subsequent PBS2 separates the two orthogonally polarized signals, which are detected at the photodiodes PDx and PDy. The charge collected at point V (corresponding to point Pin Figure 15) provides a measure of (l)Grd (and its higher moments). Note that the setup is arranged in such a way, that if S happened to be a monochromatic coherent state, then it would be phase-matched to the LO at the point x, but shifted in phase by n at the pointy. Figure 19 displays Marecki's computer model plot of the predicted Casimir spectral density as a function of the distance from the plates x and the frequency co. For a comparison with quantum optics literature, he plotted the normalized difference between the vacuum and ground state spectral density in the figure (see References [5] and [6] for more detail). Note in the figure that for co< rec/a, the Casimir spectral l l density vanishes: aa,.ico,x,x) =0, while discontinuities in it appear at co = nrcc/a. Figure 20 displays the corresponding computer model plot by Marecki of the predicted "suppressed" vacuum fluctuations in the ground state relative to "undisturbed" vacuum r r r r fluctuations (in absence of the plates) in dB, l0Log 10 [ crc,,i@,x, x)/crvacCco,x,x)]. 1mm y-Direction Casimir plate TEl coherent field (Local Osclllator) lµm x-Dlrectlon Figure 16. Diagram of Casimir Cavity with BHD Photodiodes. (courtesy of P. Marecki) Side view: -1000 -500 500 1000 o y [µm] Figure 17. Experimental Setup of BHD Photodiodes and LO Field. (courtesy of P. Marecki) This setup is drawn on the plot of the y-component of the electric field of the TEl mode of the Casimir cavity. The mode, serving as the LO, propagates in the z direction perpendicular to the plot. 1.0 ,....., 0.8 [ 0.6 ';;' 0.4 0.2 0.0 UNCLASSIFIED//fOtt 8ffl@IAl l::ISIE 8,.l\f 40