AAWSAP DIRD, Quantum Tomography of Negative Energy States in the Vacuum, January 2011
DOW-UAP-D153 · page 45 of 51
Text
This text came with the file. It may have mistakes. When the text and the image disagree, the image is right.
UNCLASSIFIED/ /FOR. OFFICIAL 891!! Oflt I
LO
s
lo
s
s
PDx
PBS1
HWP
PBS2
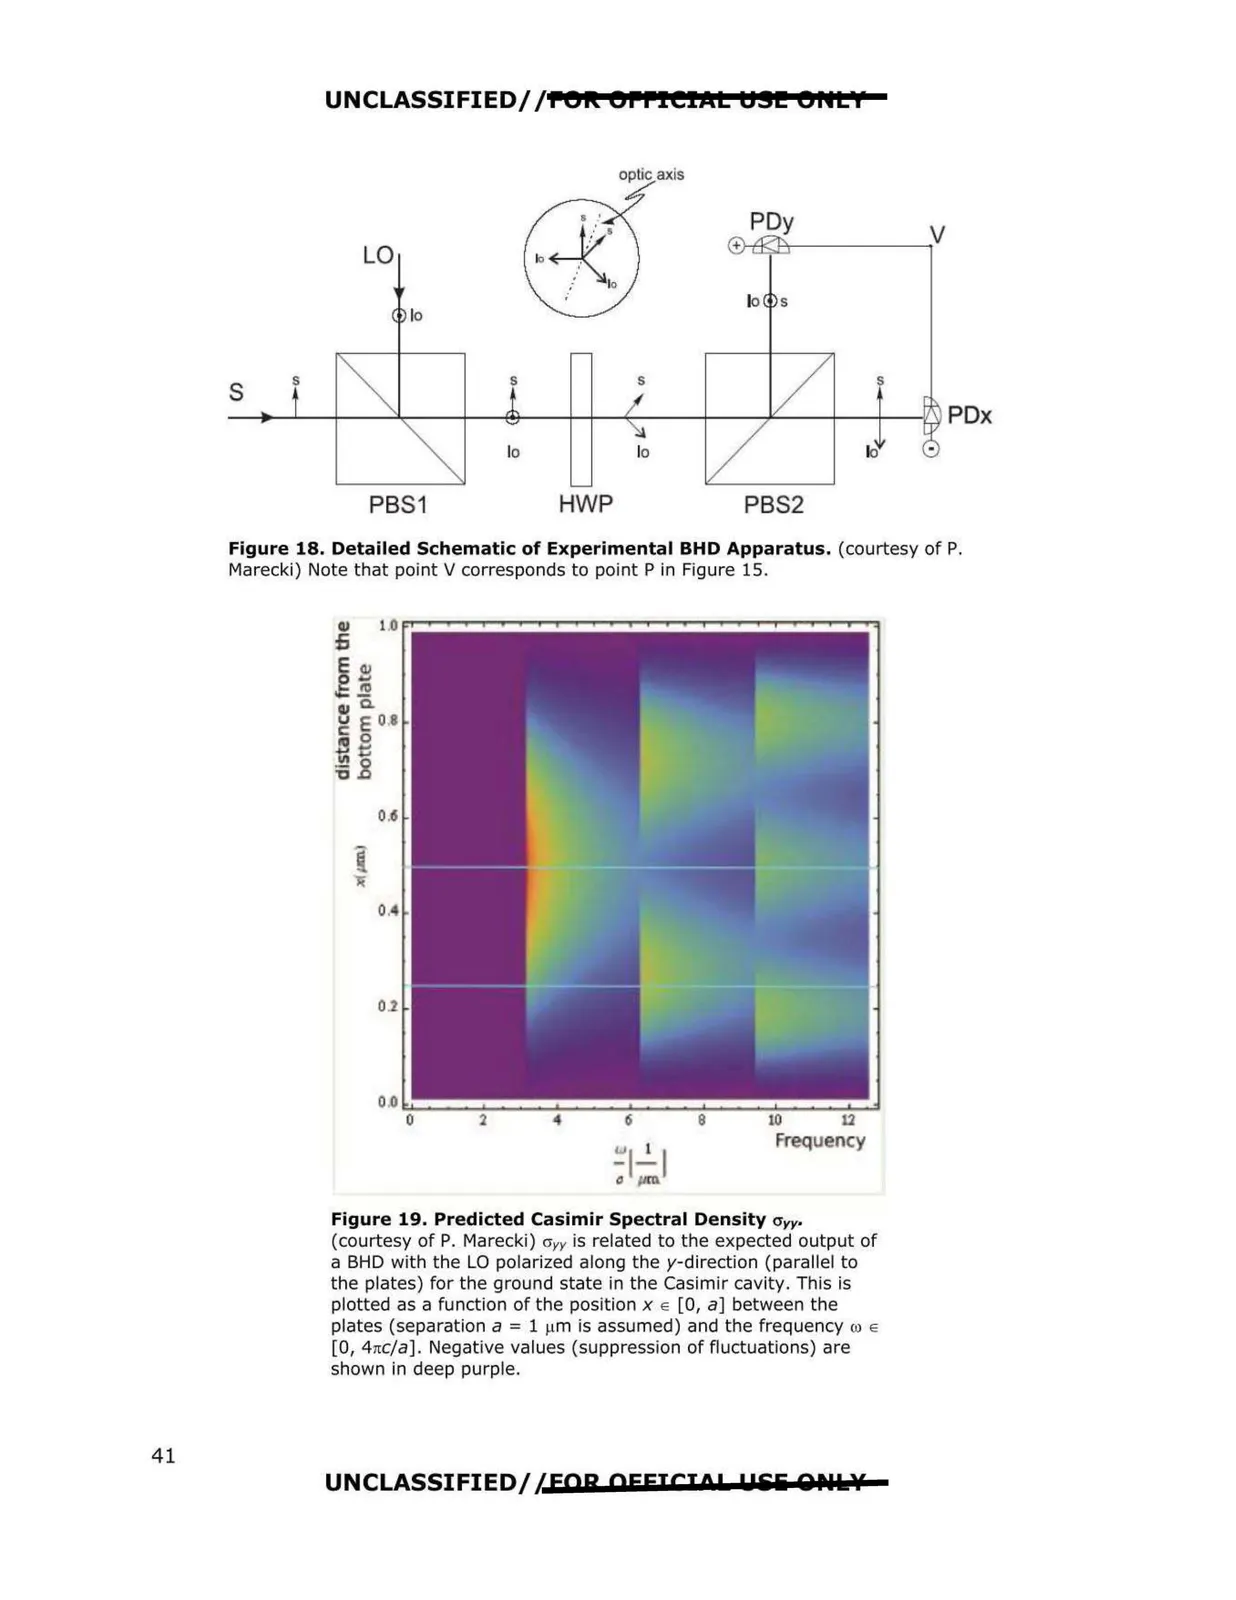
Figure 18. Detailed Schematic of Experimental BHD Apparatus. (courtesy of P.
Marecki) Note that point V corresponds to point Pin Figure 15.
0,
2
4
6
8
10
12
Frequency
Figure 19. Predicted Casimir Spectral Density O'rr
(courtesy of P. Marecki) cryy is related to the expected output of
a BHD with the LO polarized along the y-direction (parallel to
the plates) for the ground state in the Casimir cavity . This is
plotted as a function of the position x e [0, a] between the
plates (separation a = 1 µm is assumed) and the frequency w e
[O , 4nc/a]. Negative values (suppression of fluct uations) are
shown in deep purple.
UNCLASSIFIED/ 1EOR OFFICIO! u&'li QNl:.?f
41