Department of the Air Force Report, 1996
DOW-UAP-D048 · page 26 of 181
Text
This text came with the file. It may have mistakes. When the text and the image disagree, the image is right.
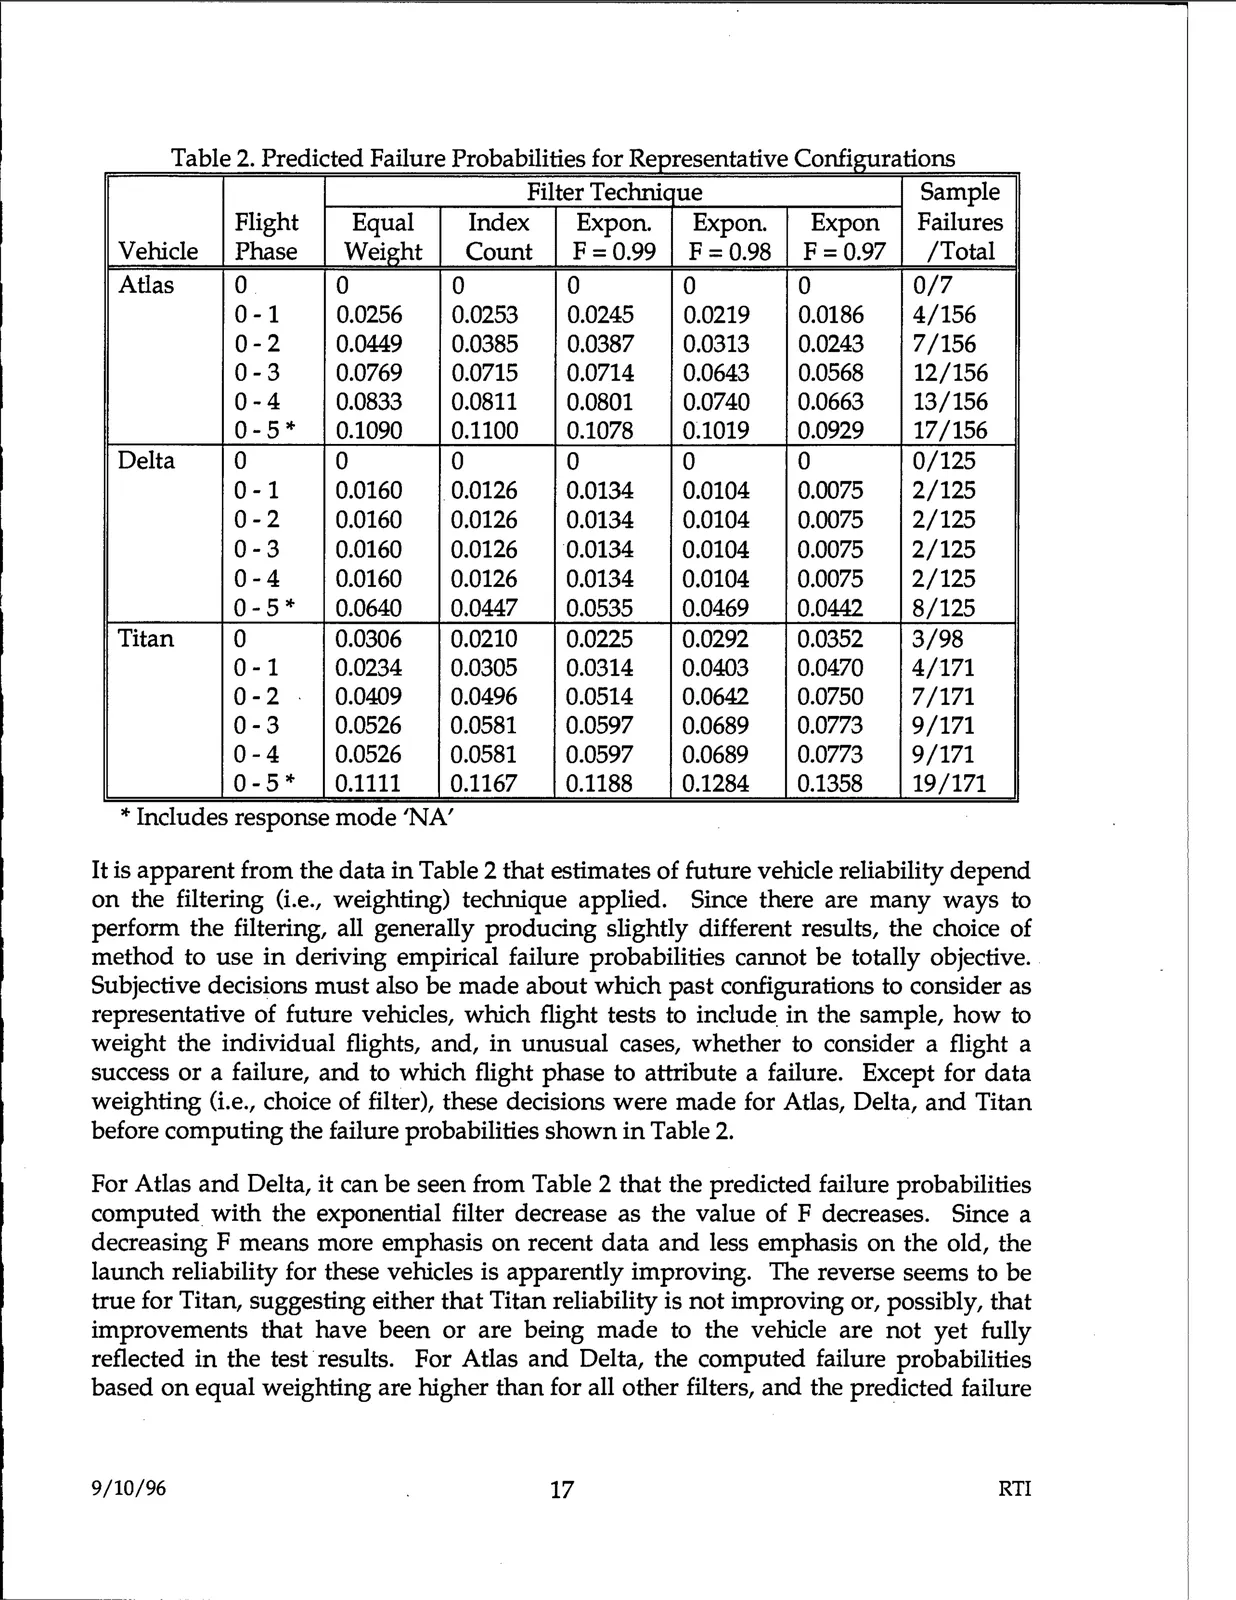
Table 2. Predicted Failure Probabilities for Representative Configurations
Vehicle
Flight
Phase
Filter Technic ue
Sample
Failures
/Total
Equal
Weight
Index
Count
Expon.
F =0.99
Expon.
F = 0.98
Expon
F = 0.97
Atlas
0
0
0
0
0
0
0/7
0-1
0.0256
0.0253
0.0245
0.0219
0.0186
4/156
0-2
0.0449
0.0385
0.0387
0.0313
0.0243
7/156
0-3
0.0769
0.0715
0.0714
0.0643
0.0568
12/156
0-4
0.0833
0.0811
0.0801
0.0740
0.0663
13/156
0-5*
0.1090
0.1100
0.1078
0~1019
0.0929
17/156
Delta
0
0
0
0
0
0
0/125
0-1
0.0160
. 0.0126
0.0134
0.0104
0.0075
2/125
0-2
0.0160
0.0126
0.0134
0.0104
0.0075
2/125
0-3
0.0160
0.0126
·o.0134
0.0104
0.0075
2/125
0-4
0.0160
0.0126
0.0134
0.0104
0.0075
2/125
0-5*
0.0640
0.0447
0.0535
0.0469
0.0442
8/125
Titan
0
0.0306
0.0210
0.0225
0.0292
0.0352
3/98
0-1
0.0234
0.0305
0.0314
0.0403
0.0470
4/171
0-2
0.0409
0.0496
0.0514
0.0642
0.0750
7/171
0-3
0.0526
0.0581
0.0597
0.0689
0.0773
9/171
0-4
0.0526
0.0581
0.0597
0.0689
0.0773
9/171
0-5*
0.1111
0.1167
0.1188
0.1284
0.1358
19/171
* Includes response mode 'NA'
It is apparent from the data in Table 2 that estimates of future vehicle reliability depend
on the filtering (i.e., weighting) technique applied. Since there are many ways to
perform the filtering, all generally producing slightly different results, the choice of
method to use in deriving empirical failure probabilities cannot be totally objective.
Subjective decisions must also be made about which past configurations to consider as
representative of future vehicles, which flight tests to include_ in the sample, how to
weight the individual flights, and, in unusual cases, whether to consider a flight a
success or a failure, and to which flight phase to attribute a failure. Except for data
weighting (i.e., choice of filter), these decisions were made for Atlas, Delta, and Titan
before computing the failure probabilities shown in Table 2.
•
For Atlas and Delta, it can be seen from Table 2 that the predicted failure probabilities
computed. with the exponential filter decrease as the value of F decreases. Since a
decreasing F means more emphasis on recent data and less emphasis on the old, the
launch reliability for these vehicles is apparently improving. The reverse seems to be
true for Titan, suggesting either that Titan reliability is not improving or, possibly, that
improvements that have been or are being made to the vehicle are not yet fully
reflected in the test· results. For Atlas and Delta, the computed failure probabilities
based on equal weighting are higher than for all other filters, and the predicted failure
9/10/96
17
RTI