Department of the Air Force Report, 1996
DOW-UAP-D048 · page 34 of 181
Text
This text came with the file. It may have mistakes. When the text and the image disagree, the image is right.
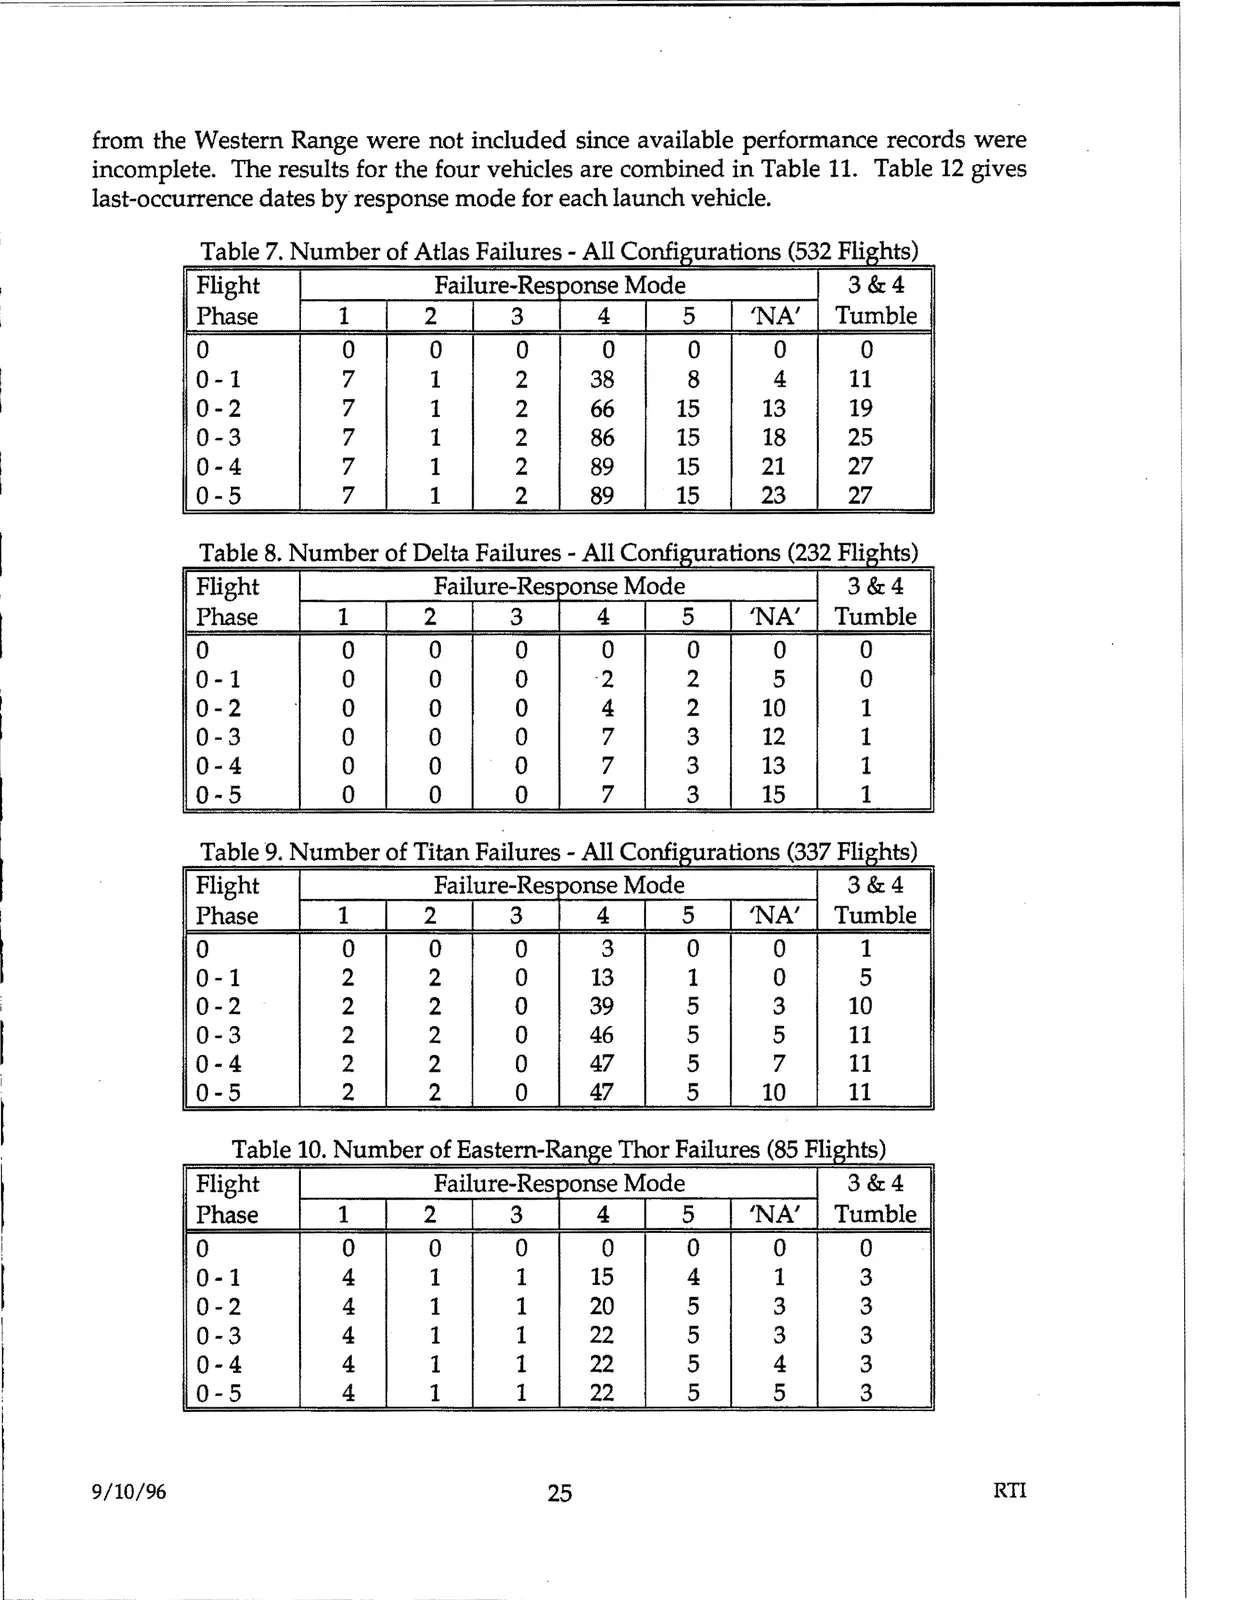
from the Western Range were not included since available performance records were
incomplete. The results for the four vehicles are combined in Table 11. Table 12 gives
last-occurrence dates by' response mode for each launch vehicle.
Table 7. Number of Atlas Failures - All Confisrurations (532 Flights)
Flight
Failure-Res :,onse Mode
3&4
Phase
1
2
3
4
5
'NA'
Tumble
0
0
0
0
0
0
0
0
0-1
7
1
2
38
8
4
11
0-2
7
1
2
66
15
13
19
0-3
7
1
2
86
15
18
25
0-4
7
1
2
89
15
21
27
0-5
7
1
2
89
15
23
27
Table 8. Number of Delta Failures - All Configurations (232 Flights)
Flight
Failure-Res oonse Mode
3&4
Phase
1
2
4
5
'NA'
Tumble
3
0
0
0
0
0
0
0
0
·2
0-1
0
0
2
5
0
0
0-2
0
0
4
2
10
1
0
0-3
0
0
0
7
3
12
1
13
0-4
0
0
0
7
3
1
1
7
3
15
0-5
0
0
0
Table 9. Number of Titan Failures - All Configurations (337 Flights)
Flight
Phase
1
Fail
2
ure-Res
3
4
oonse Mode
5
'NA'
3&4
Tumble
0
0
0
0
3
0
0
1
0-1
2
2
0
13
1
0
5
0-2
2
2
0
39
5
3
10
0-3
2
2
0
46
5
5
11
0-4
2
2
0
47
5
7
11
0-5
2
2
0
47
5
10
11
Table 10. Number of Eastern-Range Thor Failures (85 Flights)
Flight
Failure-Res oonse Mode
3&4
Tumble
Phase
1
2
3
4
5
'NA'
0
0-1
0-2
0-3
0-4
0-5
0
4
4
4
4
4
0
0
0
0
1
1
15
4
1
1
20
5
1
1
22
5
1
1
22
5
1
1
22
5
0
1
3
3
4
5
0
3
3
3
3
3
9/10/%
25
RTI