Department of the Air Force Report, 1996
DOW-UAP-D048 · page 35 of 181
Text
This text came with the file. It may have mistakes. When the text and the image disagree, the image is right.
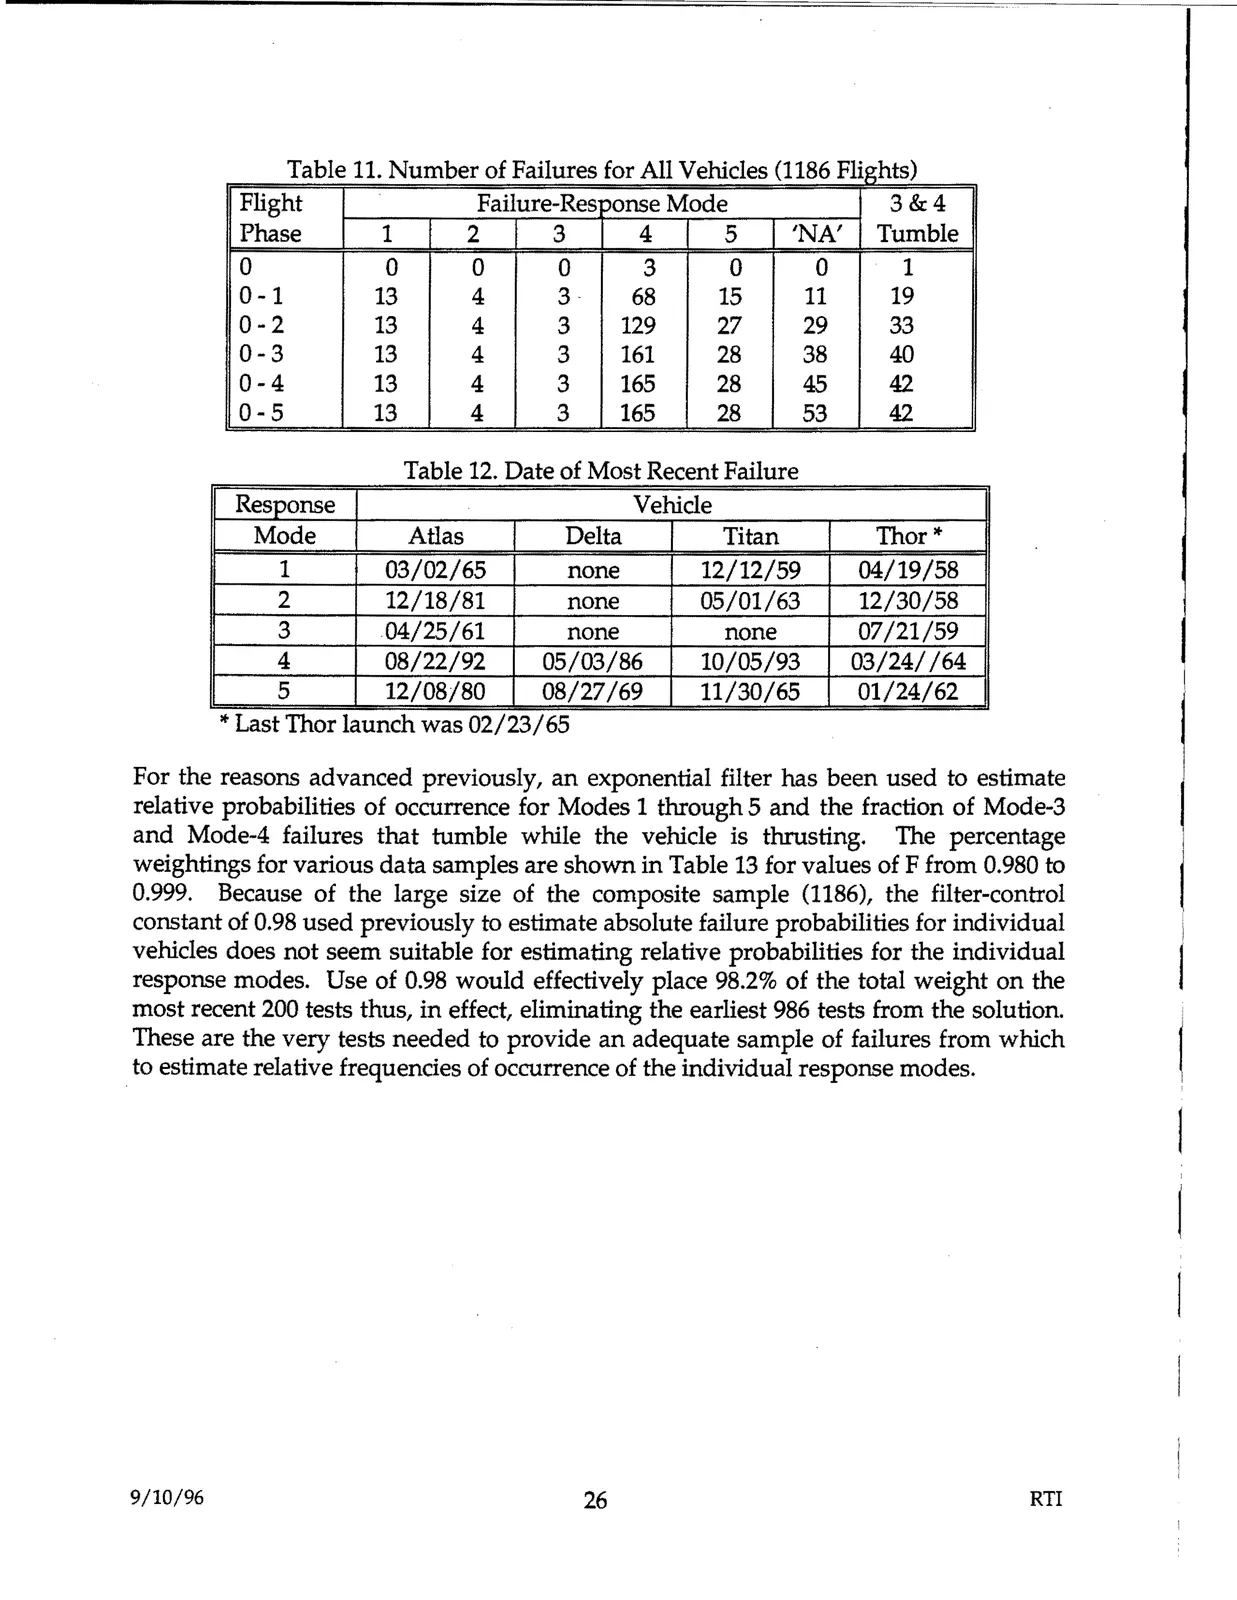
Table 11. Number of Failures for All Vehicles (1186 Flights) Flight Phase 1 Fail 2 ure-Res 3 oonse Mode 4 5 'NA' 3&4 Tumble 0 0-1 0-2 0-3 0-4 0-5 0 13 13 13 13 13 0 4 4 4 4 4 0 3 3 3 3 3 3 68 129 161 165 165 0 15 27 28 28 28 0 11 29 38 45 53 1 19 33 40 42 42 Table 12. Date of Most Recent Failure Response Vehicle Mode Atlas Delta Titan Thor* 1 03/02/65 none 12/12/59 04/19/58 2 12/18/81 none 05/01/63 12/30/58 3 .04/25/61 none none 07/21/59 4 08/22/92 05/03/86 10/05/93 03/24//64 5 12/08/80 08/27/69 11/30/65 01/24/62 *Last Thor launch was 02/23/65 For the reasons advanced previously, an exponential filter has been used to estimate relative probabilities of occurrence for Modes 1 through 5 and the fraction of Mode-3 and Mode-4 failures that tumble while the vehicle is thrusting. The percentage weightings for various data samples are shown in Table 13 for values of F from 0.980 to 0.999. Because of the large size of the composite sample (1186), the filter-control constant of 0.98 used previously to estimate absolute failure probabilities for individual vehicles does not seem suitable for estimating relative probabilities for the individual response modes. Use of 0.98 would effectively place 98.2% of the total weight on the most recent 200 tests thus, in effect, eliminating the earliest 986 tests from the solution. These are the very tests needed to provide an adequate sample of failures from which to estimate relative frequencies of occurrence of the individual response modes. 9/10/96 26 RTI