Department of the Air Force Report, 1996
DOW-UAP-D048 · page 36 of 181
Text
This text came with the file. It may have mistakes. When the text and the image disagree, the image is right.
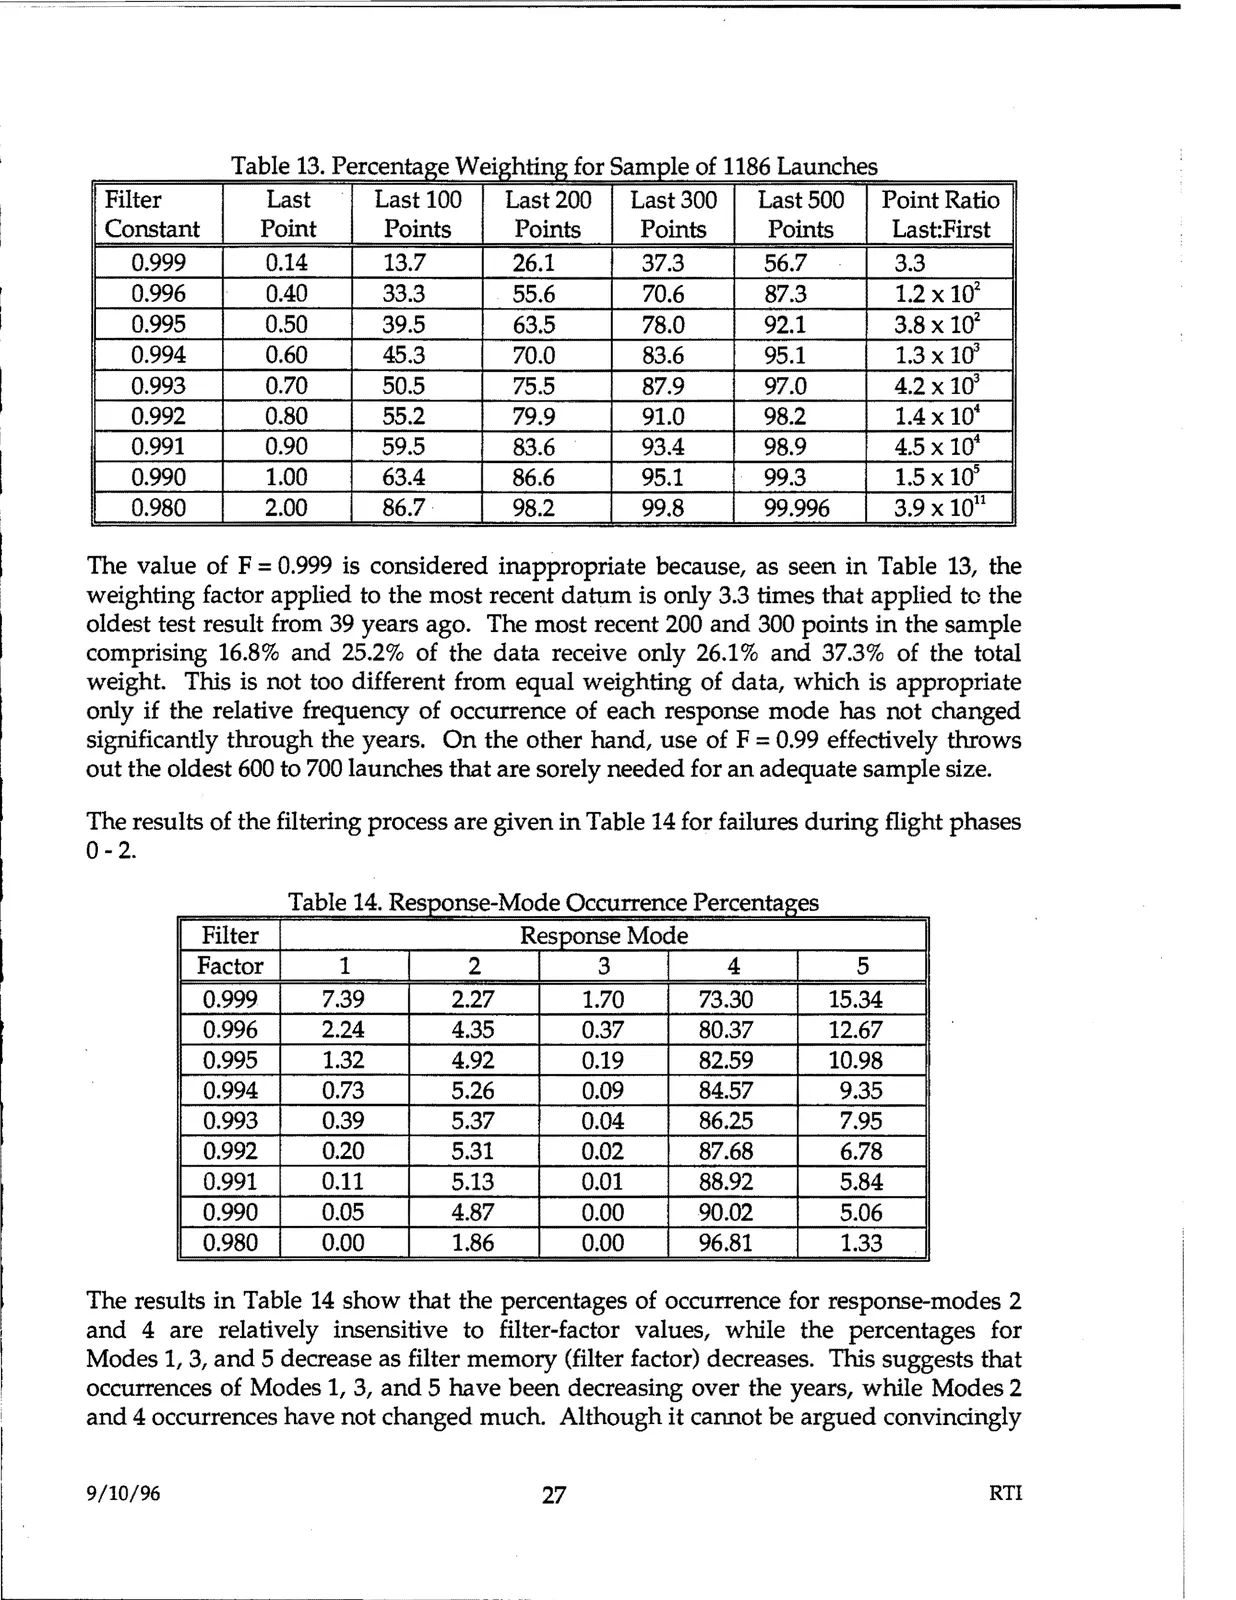
Table 13. Percentage Weighting for Sample of 1186 Launches
ter
Last
Last 100
Last200
Last 300 I i:st 500
Point Ra
Point
Points
Points
nstant
Points
Points
Last:Fir
0.999
0.14
13.7
26.1
37.3
56.7
3.3
0.996
0.40
33.3
55.6
70.6
87.3
1.2 X 1()2
0.995
0.50
39.5
63.5
78.0
92.1
3.8x 1()2
0.994
0.60
45.3
70.0
83.6
95.1
1.3x Hf
0.993
0.70
50.5
75.5
87.9
97.0
4.2 X l(f
0.992
0.80
55.2
79.9
91.0
98.2
1.4 X 10⁴
0.991
0.90
59.5
83.6
93.4
98.9
4.5 X 10⁴
0.990
1.00
63.4
86.6
95.1
99.3
1.5x Hf
0.980
2.00
86.7 ·
98.2
99.8
99.996
3.9 X 10¹¹
The value of F = 0.999 is considered inappropriate because, as seen in Table 13, the
weighting factor applied to the most recent datum is only 3.3 times that applied to the
oldest test result from 39 years ago. The most recent 200 and 300 points in the sample
comprising 16.8% and 25.2% of the data receive only 26.1% and 37.3% of the total
weight. This is not too different from equal weighting of data, which is appropriate
only if the relative frequency of occurrence of each response mode has not changed
significantly through the years. On the other hand, use of F = 0.99 effectively throws
out the oldest 600 to 700 launches that are sorely needed for an adequate sample size.
The results of the filtering process are given in Table 14 for failures during flight phases
0 - 2.
Table 14. Response-Mode Occurrence Percentages
Filter
Respcnse Mode
Factor
0.999
1
7.39
2
2.27
3
1.70
4
73.30
5
15.34
0.996
2.24
4.35
0.37
80.37
12.67
0.995
1.32
4.92
0.19
82.59
10.98
0.994
0.993
0.992
0.991
0.73
0.39
0.20
0.11
5.26
5.37
5.31
5.13
0.09
0.04
0.02
0.01
84.57
86.25
87.68
88.92
9.35
7.95
6.78
5.84
0.990
0.05
4.87
0.00
90.02
5.06
0.980
0.00
1.86
0.00
96.81
1.33
The results in Table 14 show that the percentages of occurrence for response-modes 2
and 4 are relatively insensitive to filter-factor values, while the percentages for
Modes 1, 3, and 5 decrease as filter memory (filter factor) decreases. This suggests that
occurrences of Modes 1, 3, and 5 have been decreasing over the years, while Modes 2
and 4 occurrences have not changed much. Although it cannot be argued convincingly
9/10/96
27
RTI