Department of the Air Force Report, 1996
DOW-UAP-D048 · page 38 of 181
Text
This text came with the file. It may have mistakes. When the text and the image disagree, the image is right.
Response
Mature Launch
New Solid Systems
New Liquid Systems
Mode
S stems (F =0.993)
{F =0.996)
{F = 0.999)
1
0.5
3.4
10.7
2
7.4
6.6
4.3
3
0.1
0.6
2.4
4
81.9
74.5
67.0
5
10.1
14.9
15.6
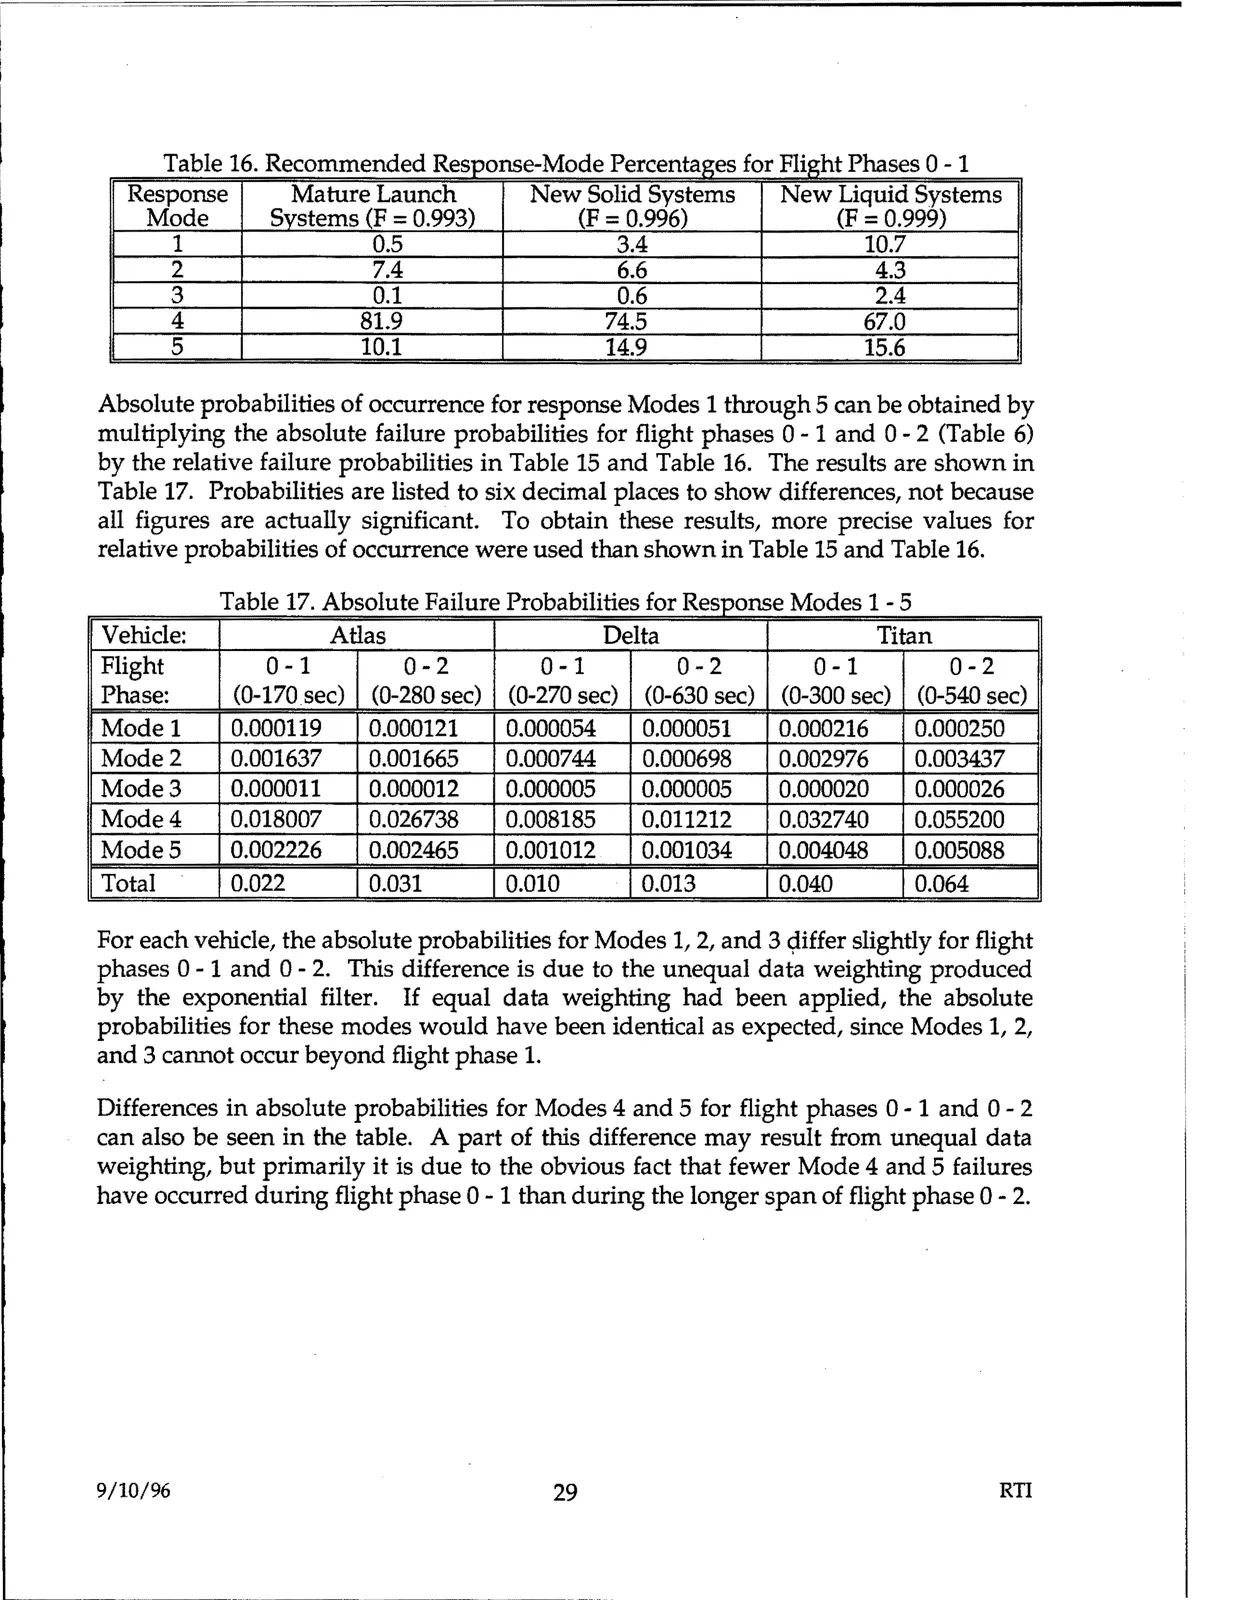
Absolute probabilities of occurrence for response Modes 1 through 5 can be obtained by
multiplying the absolute failure probabilities for flight phases 0 - 1 and 0 - 2 {Table 6)
by the relative failure probabilities in Table 15 and Table 16. The results are shown in
Table 17. Probabilities are listed to six decimal places to show differences, not because
all figures are actually significant. To obtain these results, more precise values for
relative probabilities of occurrence were used than shown in Table 15 and Table 16.
Table 17. Absolute Failure Probabilities for Response Modes 1 - 5
Vehicle:
Atlas
Delta
Titan
Flight
Phase:
0-1
0-2
(0-170 sec)
(0-280 sec)
0-1
0-2
(0-270 sec)
(0-630 sec)
0-1
(0-300 sec)
0-2
(0-540 sec)
Model
Mode2
Mode3
Mode4
0.000119
0.000121
0.001637
0.001665
0.000011
0.000012
0.018007
0.026738
0.000054
0.000051
0.000744
0.000698
0.000005
0.000005
0.008185
0.011212
0.000216
0.002976
0.000020
0.032740
0.000250
0.003437
0.000026
0.055200
Modes
0.002226
0.002465
0.001012
0.001034
0.004048
0.005088
Total
0.022
0.031
0.010
0.013
0.040
0.064
For each vehicle, the absolute probabilities for Modes 1, 2, and 3 ~iffer slightly for flight
phases 0 - 1 and 0 - 2. This difference is due to the unequal data weighting produced
by the exponential filter. If equal data weighting had been applied, the absolute
probabilities for these modes would have been identical as expected, since Modes 1, 2,
and 3 cannot occur beyond flight phase 1.
Differences in absolute probabilities for Modes 4 and 5 for flight phases O - 1 and O - 2
can also be seen in the table. A part of this difference may result from unequal data
weighting, but primarily it is due to the obvious fact that fewer Mode 4 and 5 failures
have occurred during flight phase 0 - 1 than during the longer span of flight phase 0 - 2.
9/10/96
29
RTI