Department of the Air Force Report, 1996
DOW-UAP-D048 · page 39 of 181
Text
This text came with the file. It may have mistakes. When the text and the image disagree, the image is right.
5.3 Relative Probability of Tumble for Response-Modes 3 and 4
Exponential filters with values of F from 0.98 to 0.999 have been used to- estimate the
percentage of Mode-3 and Mode-4 • responses that tenninate with a thrusting tumble.
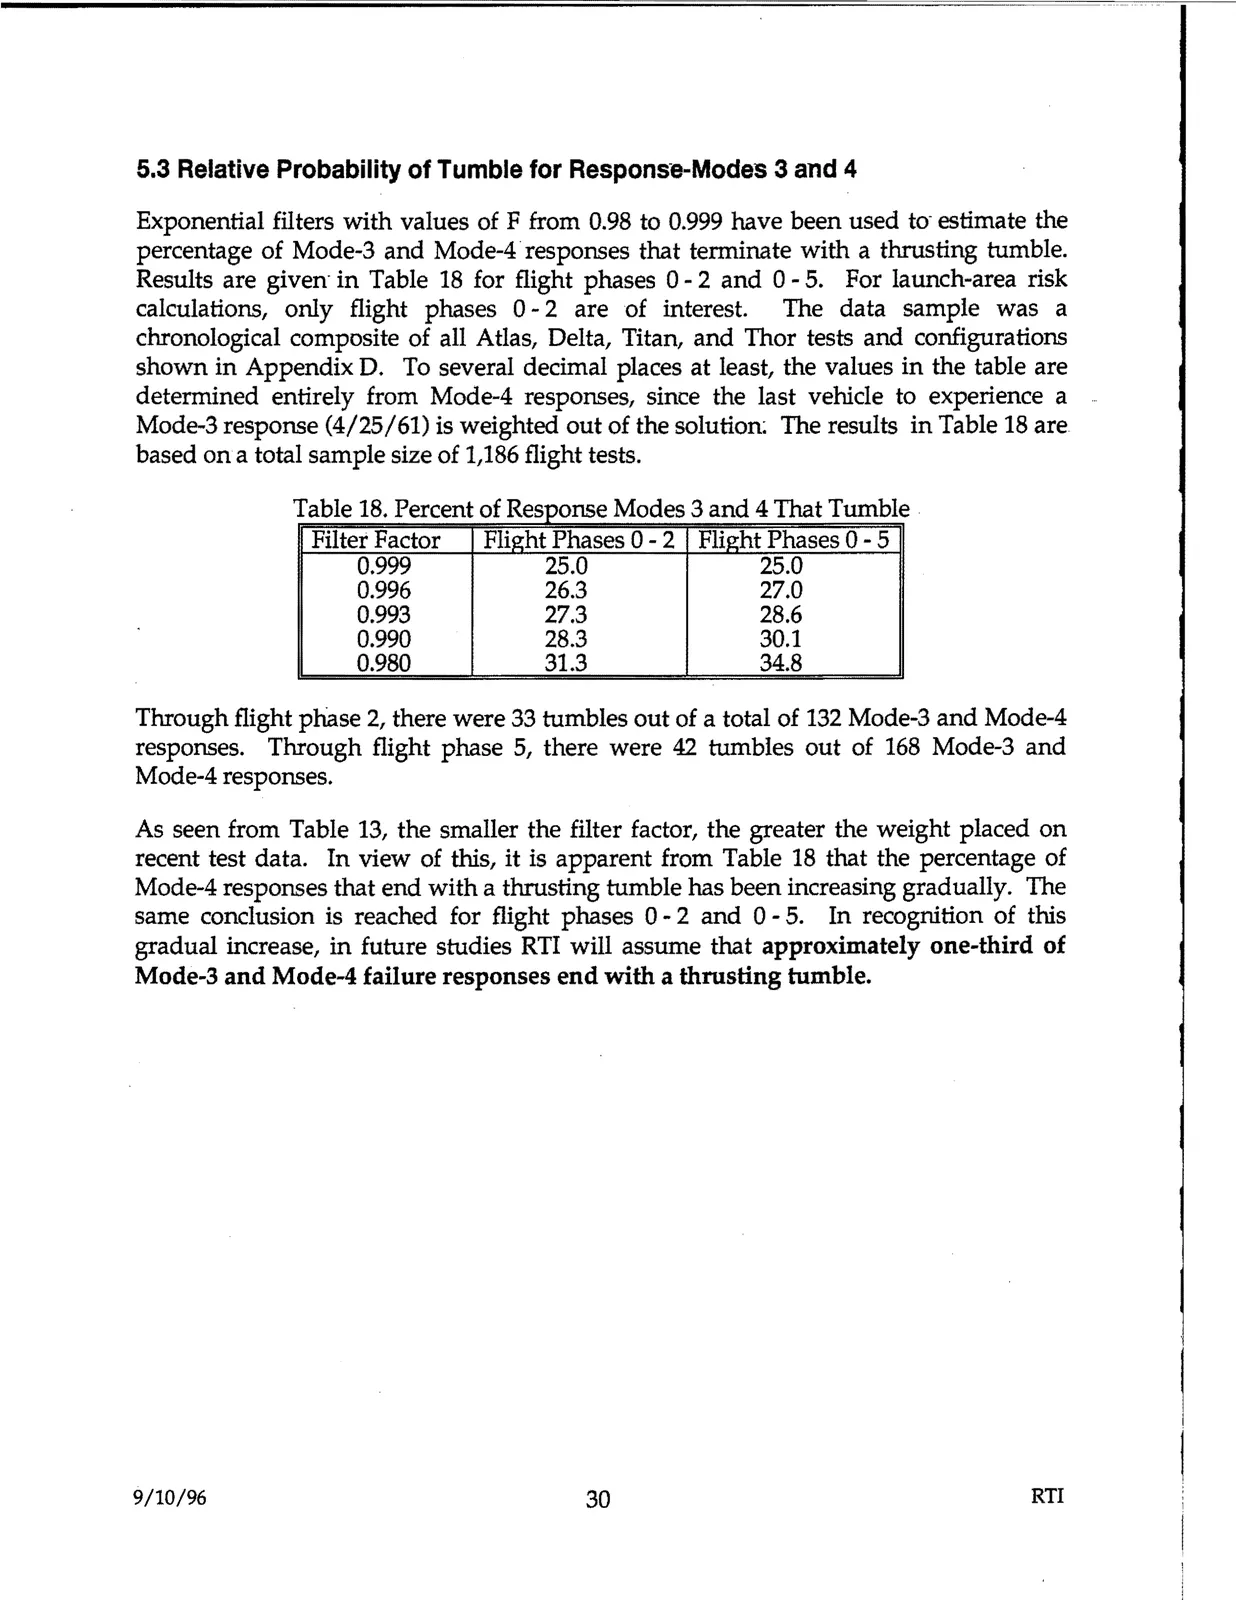
Results are given· in Table 18 for flight phases 0 - 2 and 0 - 5. For launch-area risk
calculations, only flight phases O - 2 are of interest.
The data sample was a
chronological composite of all Atlas, Delta, Titan, and Thor tests and configurations
shown in Appendix D. To several decimal places at least, the values in the table are
determined entirely from Mode-4 responses, since the last vehicle to experience a
Mode-3 response (4/25/61) is weighted out of the solution: The results in Table 18 are
based ona total sample size of 1,186 flight tests.
Table 18. Percent of Response Modes 3 and 4 That Tumble .
Filter Factor
Flight Phases O - 2 Flie.:ht Phases 0 - 5
0.999
25.0
25.0
0.996
26.3
27.0
0.993
27.3
28.6
0.990
28.3
30.1
0.980
31.3
34.8
Through flight phase 2, there were 33 tumbles out of a total of 132 Mode-3 and Mode-4
responses. Through flight phase 5, there were 42 tumbles out of 168 Mode-3 and
Mode-4 responses.
As seen from Table 13, the smaller the filter factor, the greater the weight placed on
recent test data. In view of this, it is apparent from Table 18 that the percentage of
Mode-4 responses that end with a thrusting tumble has been increasing gradually. The
same conclusion is reached for flight phases 0 - 2 and 0 - 5. In recognition of this
gradual increase, in future studies RTI will assume that approximately one-third of
Mode-3 and Mode-4 failure responses end with a thrusting tumble.
9/10/96
30