Department of the Air Force Report, 1996
DOW-UAP-D048 · page 57 of 181
Text
This text came with the file. It may have mistakes. When the text and the image disagree, the image is right.
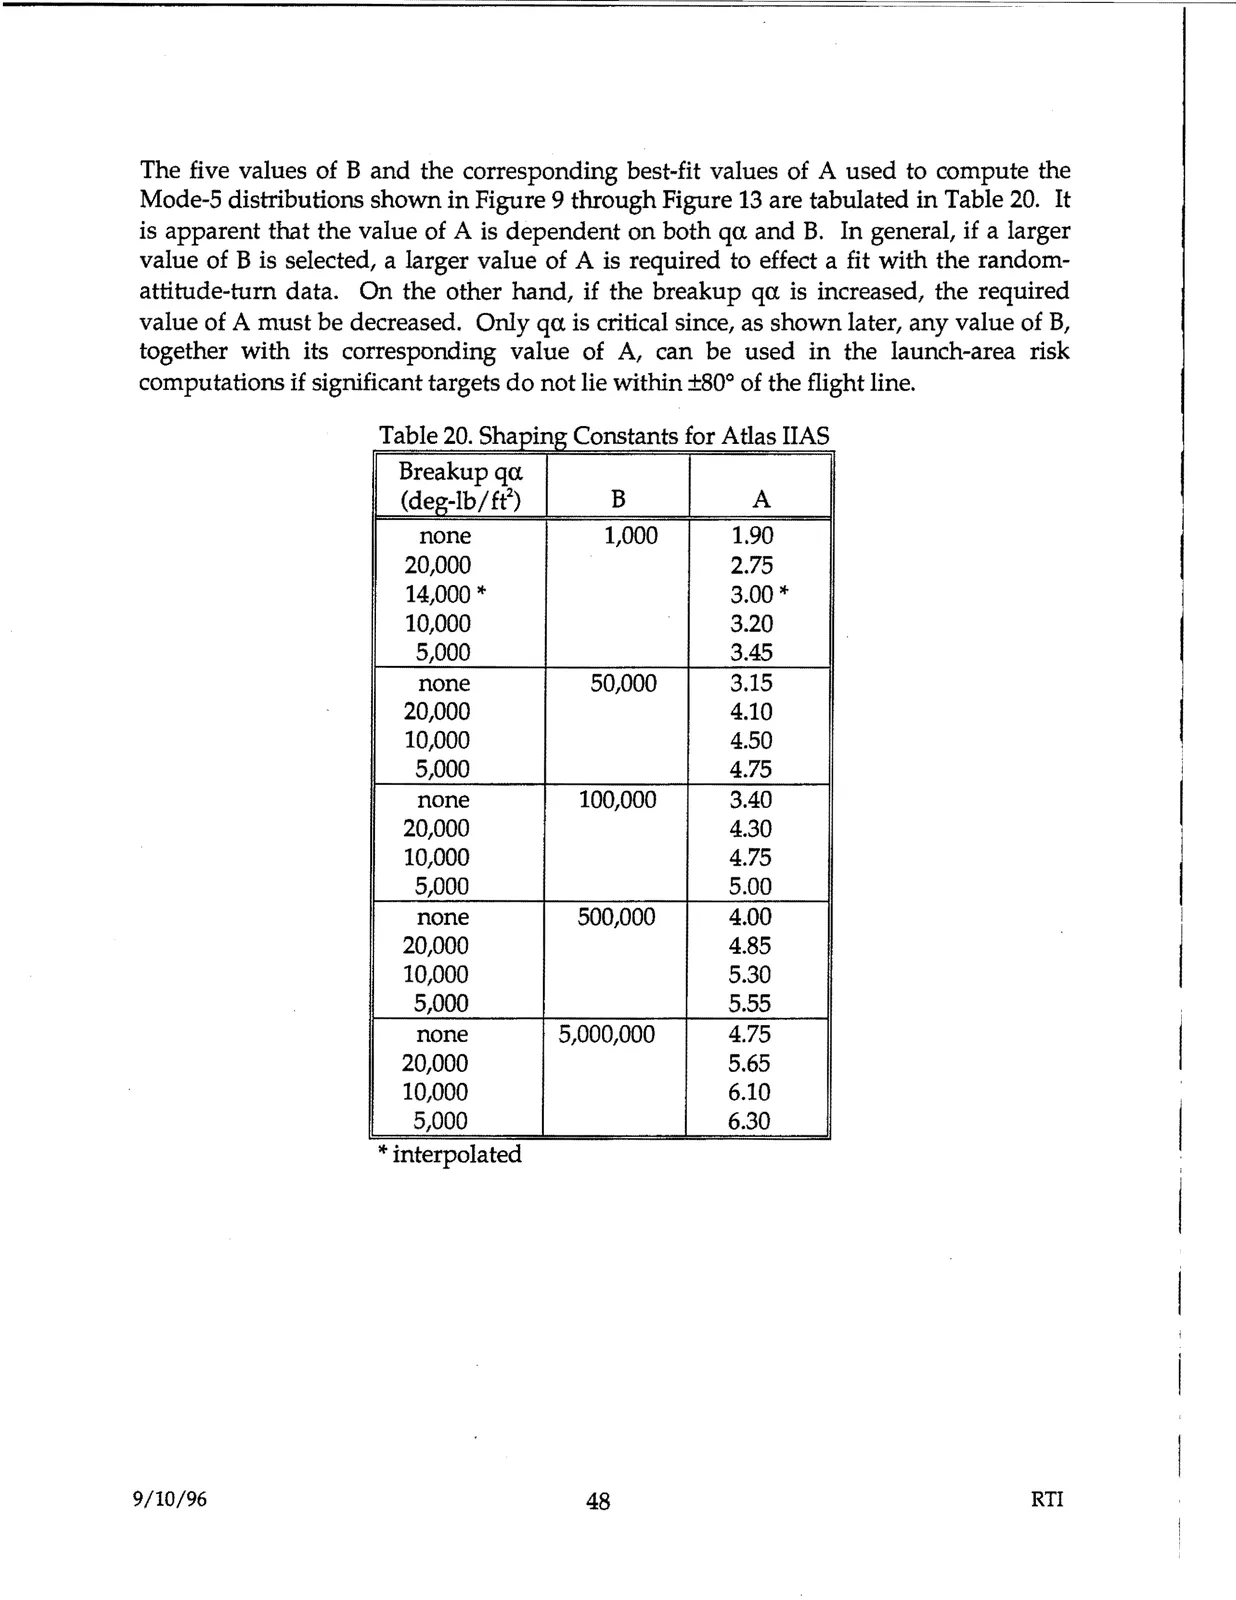
The five values of B and the corresponding best-fit values of A used to compute the
Mode-5 distributions shown in Figure 9 through Figure 13 are tabulated in Table 20. It
is apparent that the value of A is dependent on both qcx. and B. In general, if a larger
value of B is selected, a larger value of A is required to effect a fit with the random-
attitude-tum data. On the other hand, if the breakup qcx. is increased, the required
value of A must be decreased. Only qcx. is critical since, as shown later, any value of B,
together with its corresponding value of A, can be used in the launch-area risk
computations if significant targets do not lie within ±80° of the flight line.
Table 20. Shaping Constants for Atlas IIAS
Breakup qcx.
(deg-lb/ft2)
B
A
none
1,000
1.90
20,000
2.75
14,000 *
3.00*
10,000
3.20
5,000
3.45
none
50,000
3.15
20,000
4.10
10,000
4.50
5,000
4.75
none
100,000
3.40
20,000
4.30
10,000
4.75
5,000
5.00
none
500,000
4.00
20,000
4.85
10,000
5.30
5,000
5.55
none
5,000,000
4.75
20,000
5.65
10,000
6.10
5,000
6.30
*interpolated
9/10/96
48
RTI