Department of the Air Force Report, 1996
DOW-UAP-D048 · page 58 of 181
Text
This text came with the file. It may have mistakes. When the text and the image disagree, the image is right.
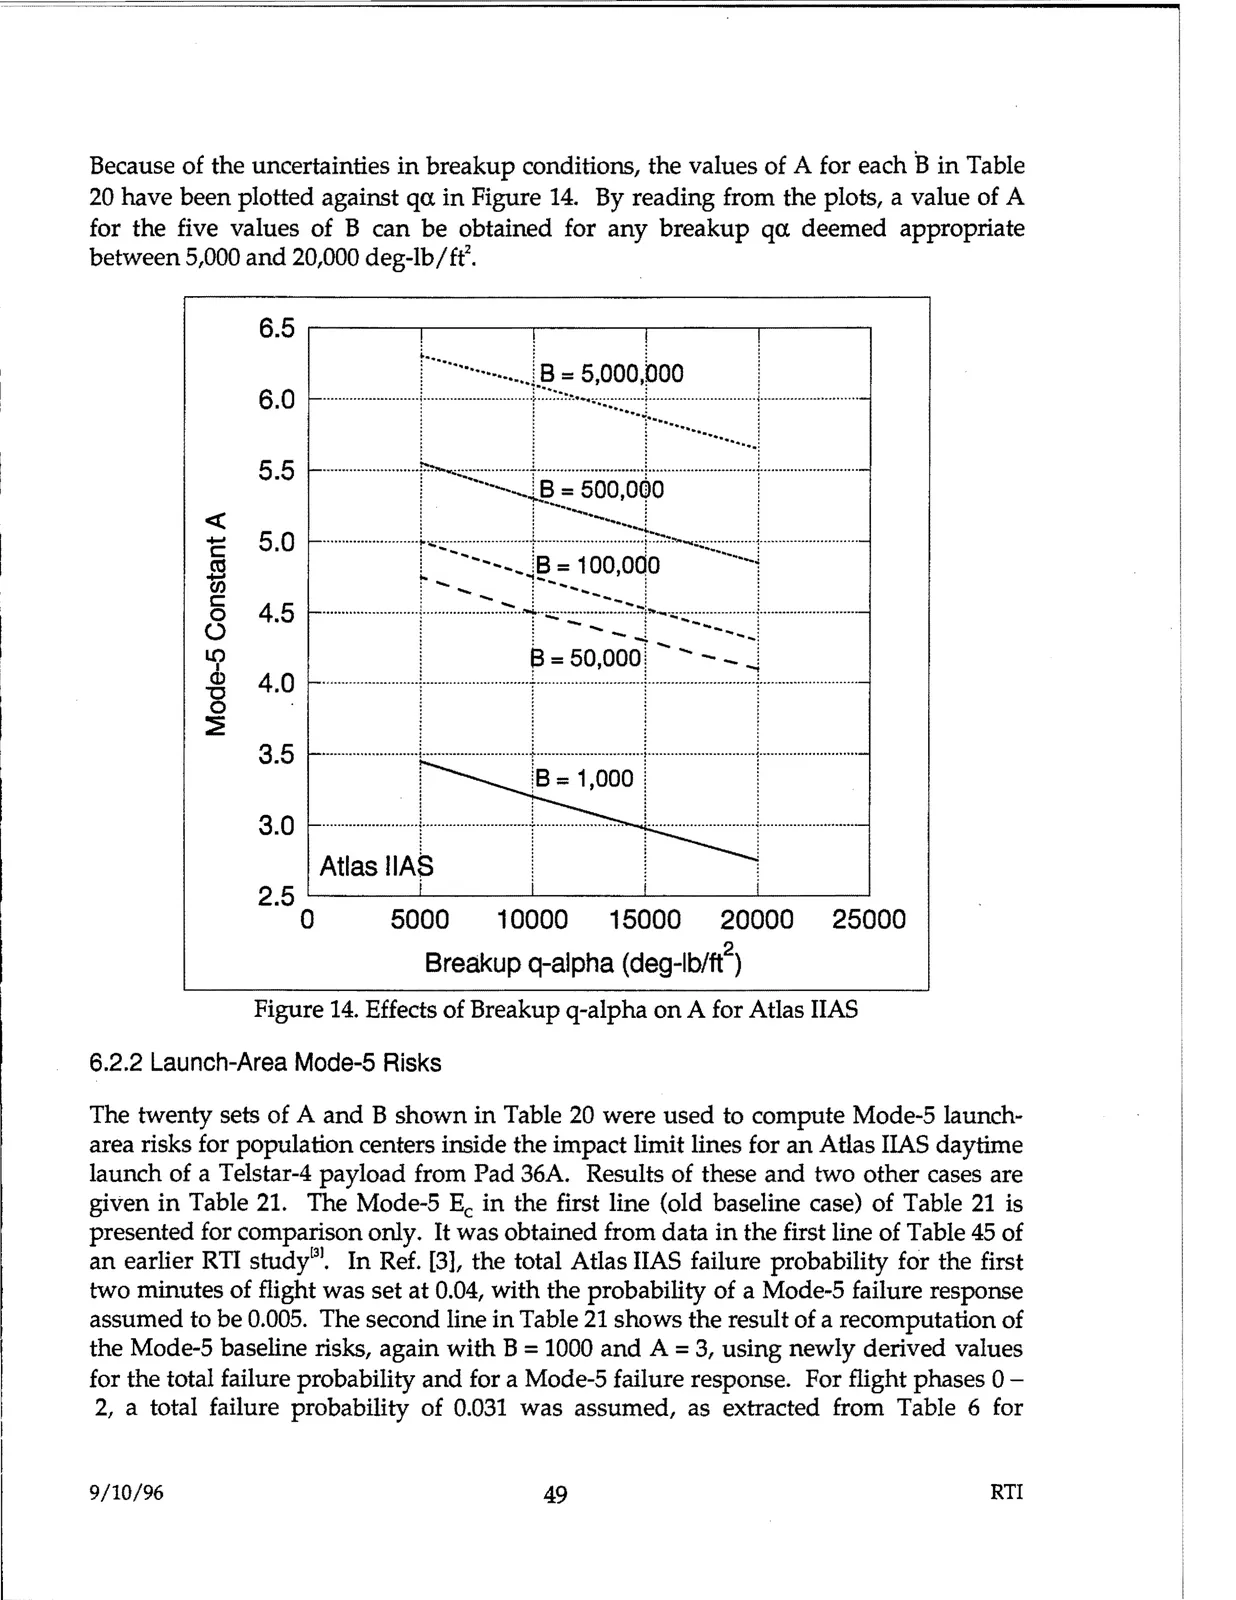
--- --- Because of the uncertainties in breakup conditions, the values of A for each Bin Table 20 have been plotted against qa in Figure 14. By reading from the plots, a value of A for the five values of B can be obtained for any breakup qa. deemed appropriate between 5,000 and 20,000 deg-lb/ft2. 6.5 6.0 5.5 <C ..... C 5.0 -ffl 0 C 4.5 (.) ~ "'C 4.0 0 :l:? 3.5 3.0 2.5 0 r················..l.B = 5,000,000 ____ __ L _I_ ---------------r----------------i _______ __ I ----.l._B = 500,000 : .........................l.. .....................1..·--............t---...................... 1.......................... i ................ is= 1oo,odo ···-----➔ r---_-_-r-:-:-~-t-----__J------ ! 13 = 50,000! - - - ! ·························!····························'························-··i·························i····••··················· I I I I • ••••••••••i•H•---~iHH--•.. ••••i••••u..•••••uu•u•••••• !B = 1,000 I I i i i ~~;·::··;·;;;·························I······················· ·····························:·················· •••••• 5000 10000 15000 20000 25000 Breakup q-alpha (deg-lb/ft2) Figure 14. Effects of Breakup q-alpha on A for Atlas HAS 6.2.2 Launch-Area Mode-5 Risks The twenty sets of A and B shown in Table 20 were used to compute Mode-5 launch- area risks for population centers inside the impact limit lines for an Atlas HAS daytime launch of a Telstar-4 payload from Pad 36A. Results of these and two other cases are given in Table 21. The Mode-5 Ee in the first line (old baseline case) of Table 21 is presented for comparison only. It was obtained from data in the first line of Table 45 of an earlier RTI study131. In Ref. [3], the total Atlas IIAS failure probability for the first two minutes of flight was set at 0.04, with the probability of a Mode-5 failure response assumed to be 0.005. The second line in Table 21 shows the result of a recomputation of the Mode-5 baseline risks, again with B = 1000 and A= 3, using newly derived values for the total failure probability and for a Mode-5 failure response. For flight phases 0 2, a total failure probability of 0.031 was assumed, as extracted from Table 6 for 9/10/96 49 RTI