Department of the Air Force Report, 1996
DOW-UAP-D048 · page 67 of 181
Text
This text came with the file. It may have mistakes. When the text and the image disagree, the image is right.
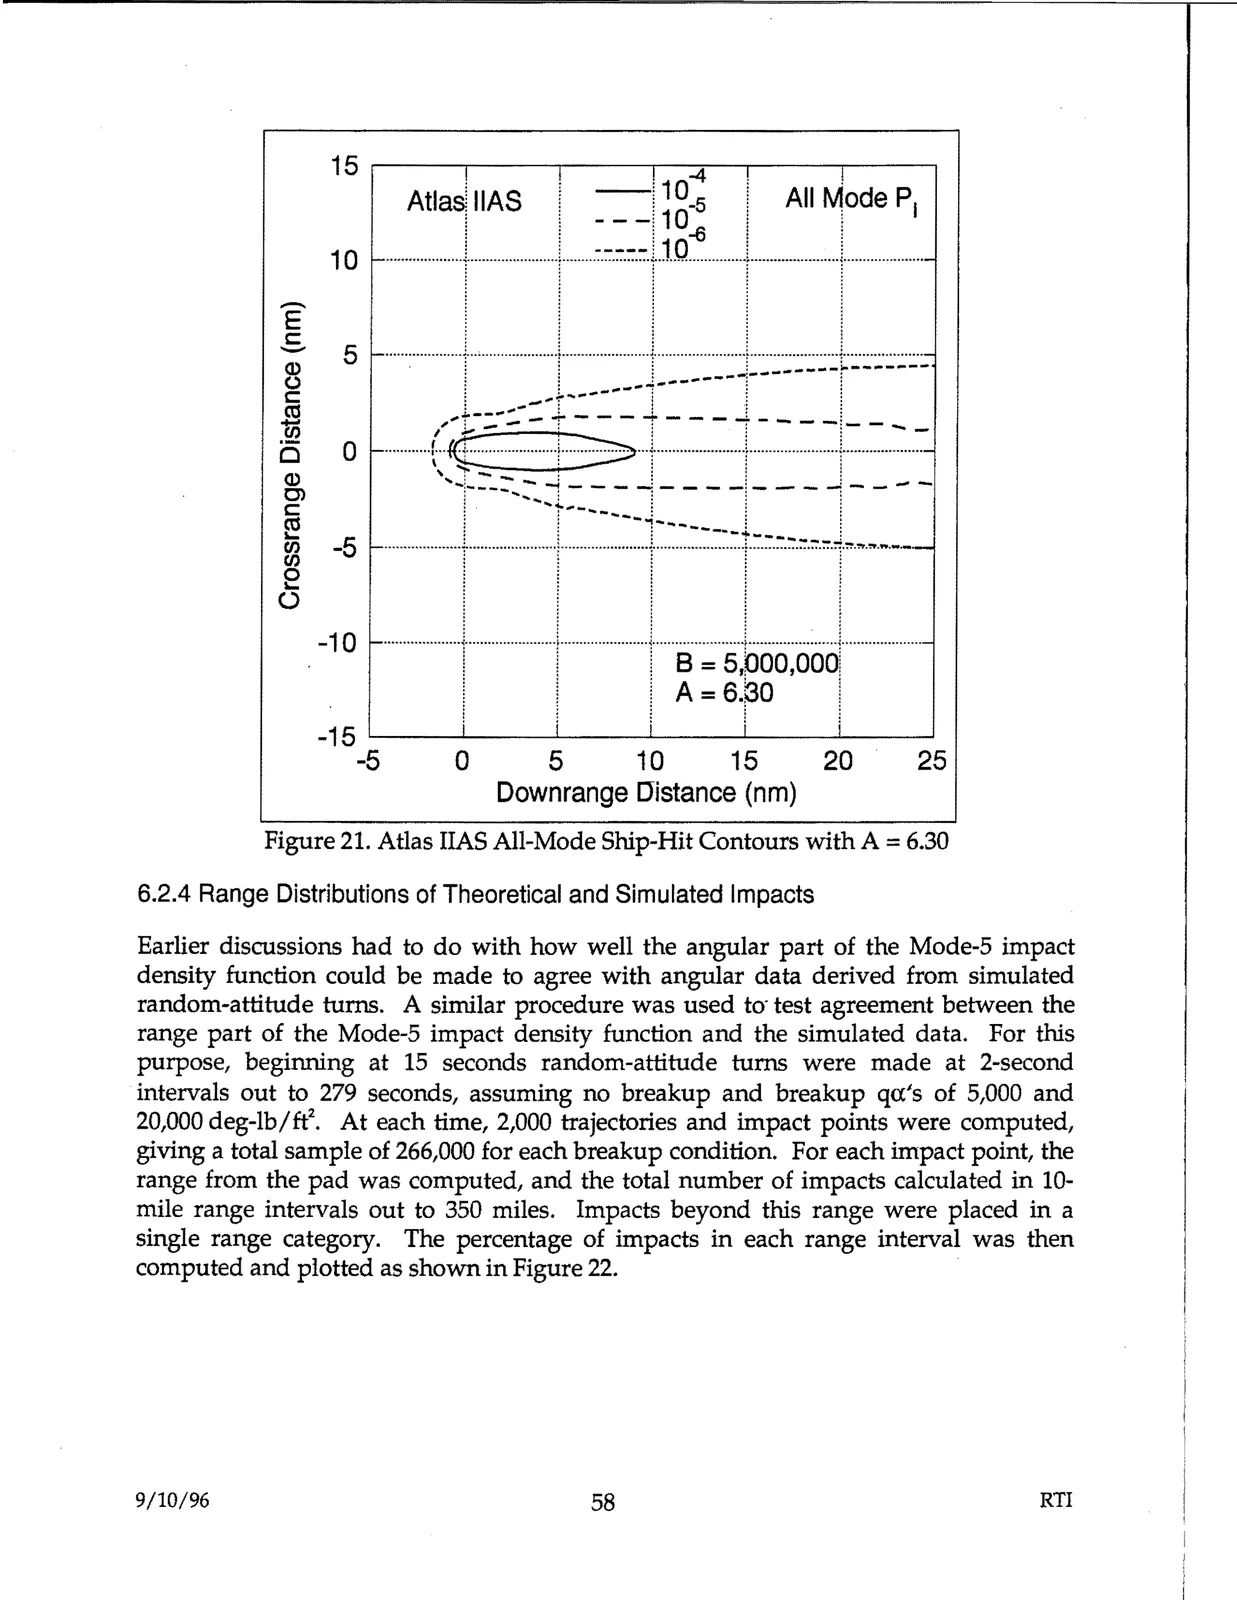
15 .---~------.---~-----. 1o , ! !, !104 ! Atla~ I IAS , -! -5 All f\1ode P1 1 , - -, 10-6 1 ! ! -----! 10 ! ................ r......................1".....................r.............................................T.................. . - E C:- 5 I I I I ...............!.......................,.......................1.......................;.......................i.................. . ~ c CCI .... -~ • l i ~-------~--------r------ i -~--------, ! 1· i ----- i ! i ,--t .,,,. ..... -r - - ...,. - - - -+ - - - -i - ,~; ___' i - :o!s.. _: [_-1:.~:-:i=-==~-l~:-~~1.::::.i.~= ! : ! : 0 . ____ I I I I -10 - ···- ' ........._ ....................................................,--·············.......... : : 8 = 5,000,00Q A= 6.30 l -15 ....__....____ i _ _.___ __.___....__.....__ _ __, ! i -5 0 5 10 15 20 25 Downrange Distance (nm) Figure 21. Atlas HAS All-Mode Ship-Hit Contours with A = 6.30 6.2.4 Range Distributions of Theoretical and Simulated Impacts Earlier discussions had to do with how well the angular part of the Mode-5 impact density function could be made to agree with angular data derived from simulated random-attitude turns. A similar procedure was used to- test agreement between the range part of the Mode-5 impact density function and the simulated data. For this purpose, beginning at 15 seconds random-attitude turns were made at 2-second -intervals out to 279 seconds, assuming no breakup and breakup qcx:'s of 5,000 and 20,000 deg-lb/ft2. At each time, 2,000 trajectories and impact points were computed, giving a total sample of 266,000 for each breakup condition. For each impact point, the range from the pad was computed, and the total number of impacts calculated in 10 mile range intervals out to 350 miles. Impacts beyond this range were placed in a single range category. The percentage of impacts in each range interval was then computed and plotted as shown in Figure 22. 9/10/96 58 RTI