Department of the Air Force Report, 1996
DOW-UAP-D048 · page 68 of 181
Text
This text came with the file. It may have mistakes. When the text and the image disagree, the image is right.
1-
100
10
E
C: 0
T"""
.5
l
1
E
C: -
~
Cl)
a.
0.1
~....- - .... - - - ... ......-.....- ....- - .....~
....-...........-.....~-
......~....-.....- -
..
...........~................~-
.....~...........-
-
..........-.....-
..........~
·········••E=E.Al'r••".ASJ• =!= !=:::::::::::
..............-!- Theoretical................!...................!...................!................ _...
:
:
:
:
:
:
2
...................;...........Br~akup..q~alphal.;;;;......5.,.opo...de9,::lb/ft2.. f···
. -t - Br~akup q-alpha! = 20,opo degrlb/ft !
• -i... NniBreaku·P.
i
i
i
i
•••••..•••••••••1,.......... •• u+
uooo ■■•~•uooo
1'
I
oo
O
oo•HHHO•
················+···········'······+···················1•· ·········=:::!==····-···__.......... ·}··
~ ················r·················r··················t··········.......1........-·
:
•
:
•••••••••• r·
................... : ................... : ................... j ....................................... ; ................... ,t..............._....J...
I
I
I
I
I
I
0
50
100
150
200
250
300
350
Impact Range (nm)
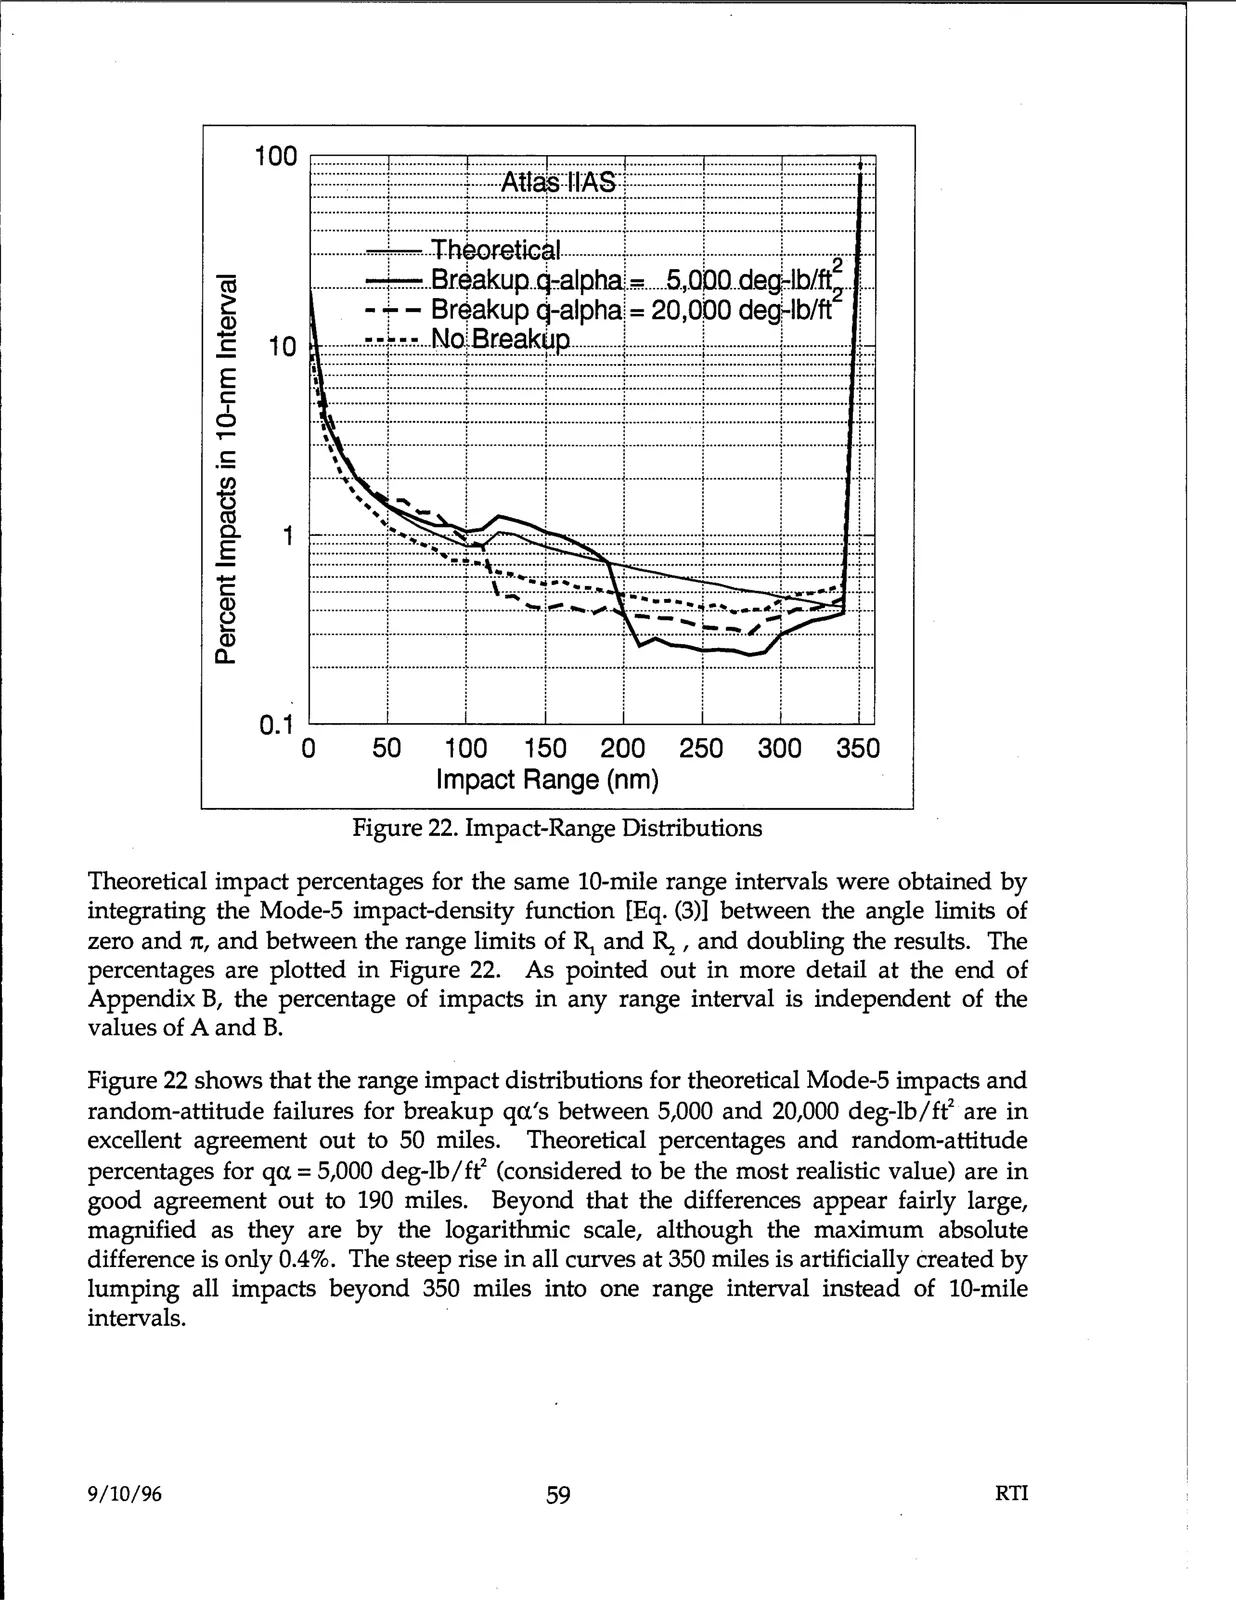
Figure 22. Impact-Range Distributions
Theoretical impact percentages for the same 10-mile range intervals were obtained by
integrating the Mode-5 impact-density function [Eq. (3)] between the angle limits of
zero and 1t, and between the range limits of ~ and ~ , and doubling the results. The
percentages are plotted in Figure 22. As pointed out in more detail at the end of
Appendix B, the percentage of impacts in any range interval is independent of the
values of A and B.
Figure 22 shows that the range impact distributions for theoretical Mode-5 impacts and
random-attitude failures for breakup qa.'s between 5,000 and 20,000 deg-lb/ft2 are in
excellent agreement out to 50 miles. Theoretical percentages and random-attitude
percentages for qa. =5,000 deg-lb/ft2 (considered to be the most realistic value) are in
good agreement out to 190 miles. Beyond that the differences appear fairly large,
magnified as they are by the logarithmic scale, although the maximum absolute
difference is only 0.4%. The steep rise in all curves at 350 miles is artificially created by
lumping all impacts beyond 350 miles into one range interval instead of 10-mile
intervals.
9/10/96
59
RTI