Department of the Air Force Report, 1996
DOW-UAP-D048 · page 73 of 181
Text
This text came with the file. It may have mistakes. When the text and the image disagree, the image is right.
6.3.2 Launch-Area Mode-5 Risks
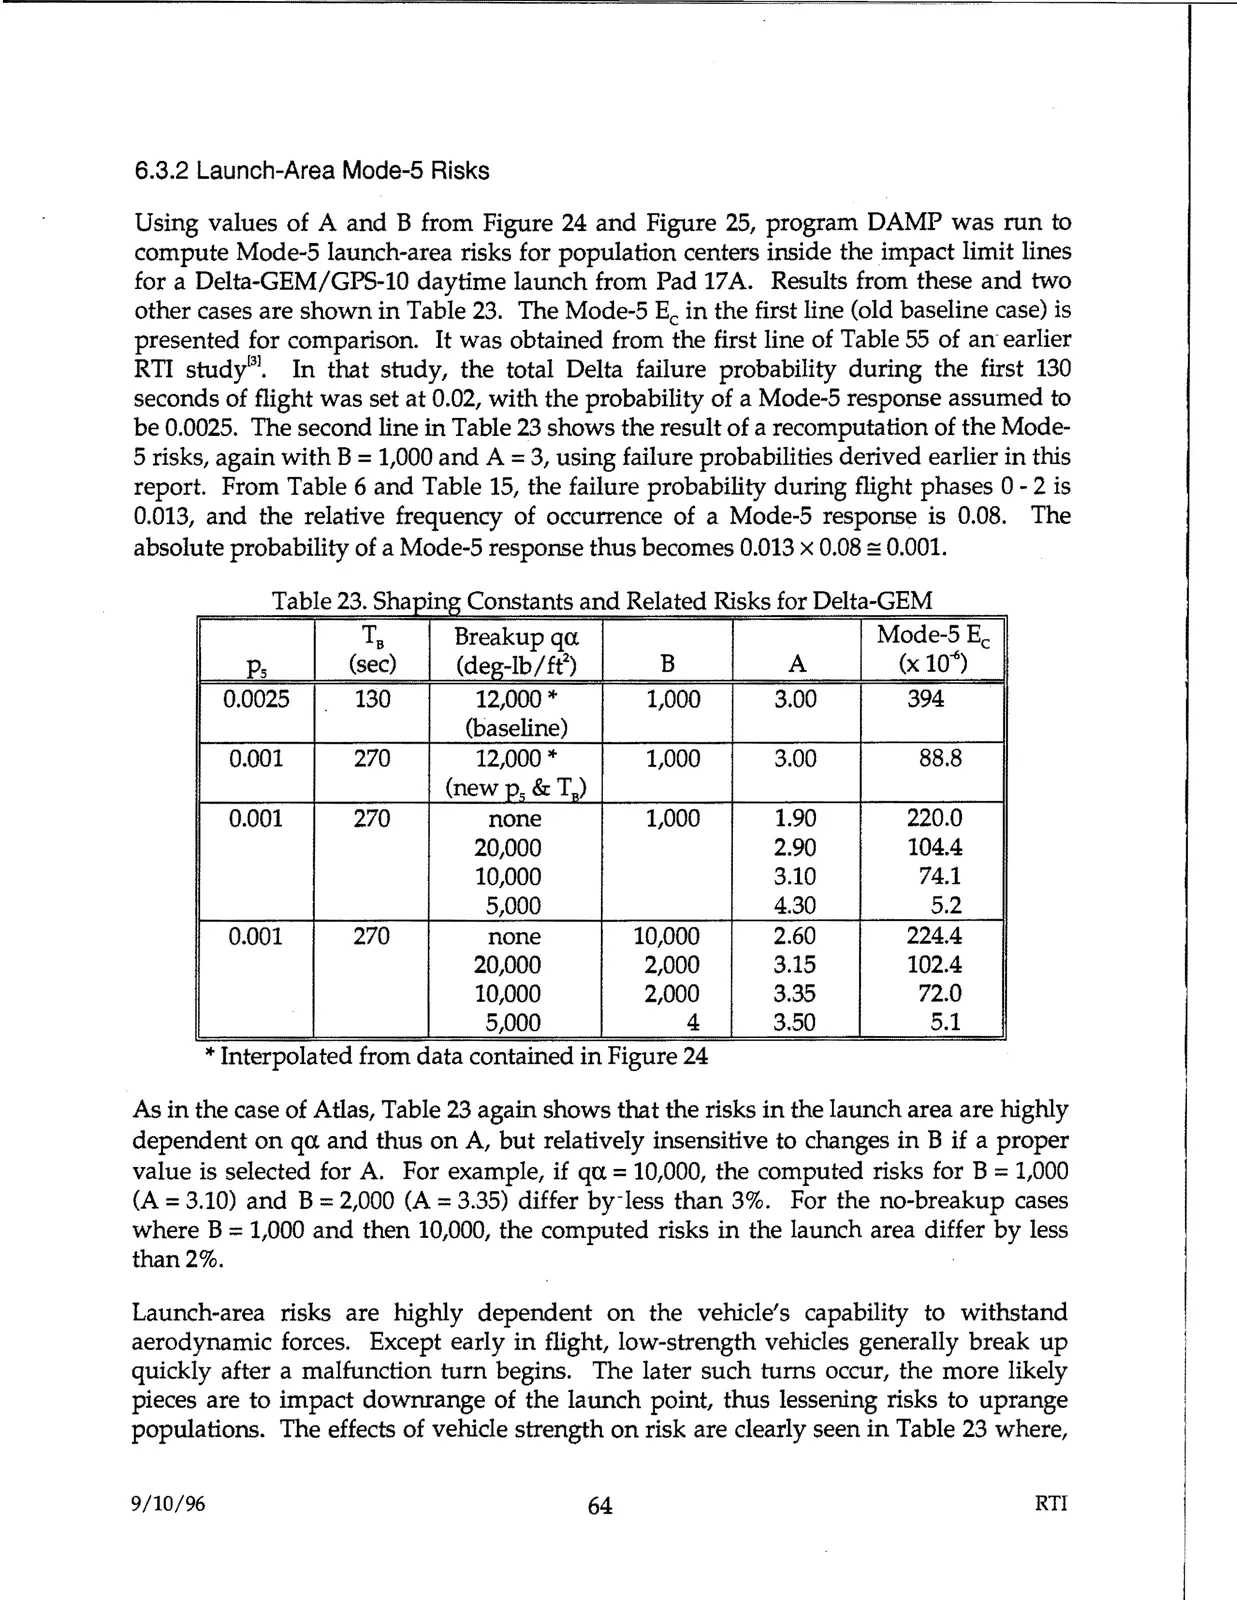
Using values of A and B from Figure 24 and Figure 25, program DAMP was run to
compute Mode-5 launch-area risks for population centers inside the impact limit lines
for a Delta-GEM/GPS-10 daytime launch from Pad 17A. Results from these and two
other cases are shown in Table 23. The Mode-5 Ee in the first line (old baseline case) is
presented for comparison. It was obtained from the first line of Table 55 of an- earlier
RTI study31• In that study, the total Delta failure probability during the first 130
seconds of flight was set at 0.02, with the probability of a Mode-5 response assumed to
be 0.0025. The second line in Table 23 shows the result of a recomputation of the Mode-
s risks, again with B =1,000 and A =3, using failure probabilities derived earlier in this
report. From Table 6 and Table 15, the failure probability during flight phases O - 2 is
0.013, and the relative frequency of occurrence of a Mode-5 response is 0.08. The
absolute probability of a Mode-5 response thus becomes 0.013 x 0.08 =0.001.
Table 23. Shaping Constants and Related Risks for Delta-GEM
TB
Breakupqa
Mode-5 Ee
Ps
(sec)
(deg-lb/ft2)
B
A
(x 104,)
0.0025
130
12,000 *
1,000
3.00
394
(baseline)
0.001
270
12,000 *
1,000
3.00
88.8
(newp,&T,.)
0.001
270
none
1,000
1.90
220.0
20,000
2.90
104.4
10,000
3.10
74.1
5,000
4.30
5.2
0.001
270
none
10,000
2.60
224.4
20,000
2,000
3.15
102.4
10,000
2,000
3.35
72.0
5,000
4
3.50
5.1
* Interpolated from data contained in Figure 24
As in the case of Atlas, Table 23 again shows that the risks in the launch area are highly
dependent on qa and thus on A, but relatively insensitive to changes in B if a proper
value is selected for A. For example, if qa. =10,000, the computed risks for B =1,000
(A= 3.10) and B = 2,000 (A= 3.35) differ by-less than 3%. For the no-breakup cases
where B = 1,000 and then 10,000, the computed risks in the launch area differ by less
than2%.
Launch-area risks are highly dependent on the vehicle's capability to withstand
aerodynamic forces. Except early in flight, low-strength vehicles generally break up
quickly after a malfunction turn begins. The later such turns occur, the more likely
pieces are to impact downrange of the launch point, thus lessening risks to uprange
populations. The effects of vehicle strength on risk are clearly seen in Table 23 where,
9/10/96
64
RT!