Department of the Air Force Report, 1996
DOW-UAP-D048 · page 75 of 181
Text
A machine read this text from the scan. When the text and the image disagree, the image is right.
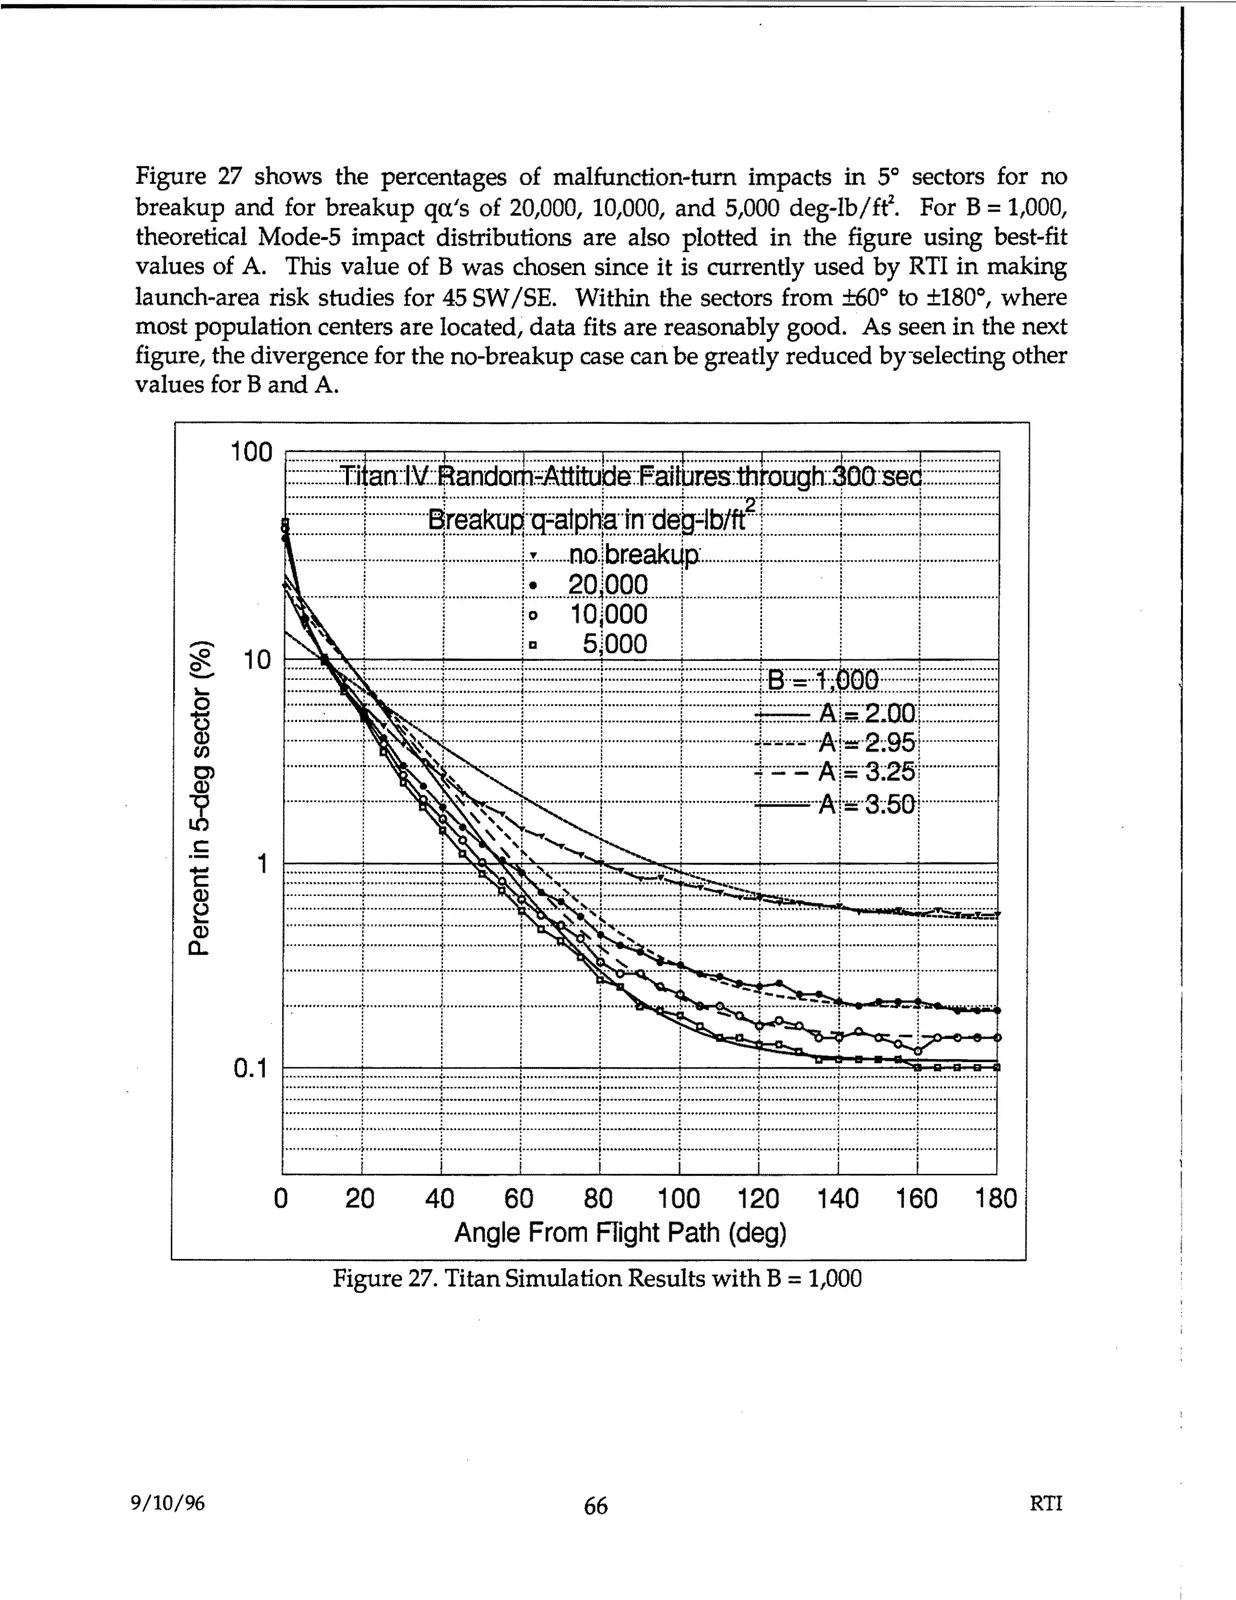
Figure 27 shows the percentages of malfunction-turn impacts in 5° sectors for no breakup and for breakup qα's of 20,000, 10,000, and 5,000 deg-lb/ft². For B = 1,000, theoretical Mode-5 impact distributions are also plotted in the figure using best-fit values of A. This value of B was chosen since it is currently used by RTI in making launch-area risk studies for 45 SW/SE. Within the sectors from ±60° to ±180°, where most population centers are located, data fits are reasonably good. As seen in the next figure, the divergence for the no-breakup case can be greatly reduced by selecting other values for B and A.

Figure 27. Titan Simulation Results with B = 1,000

9/10/96

66

RTI