Department of the Air Force Report, 1996
DOW-UAP-D048 · page 76 of 181
Text
This text came with the file. It may have mistakes. When the text and the image disagree, the image is right.
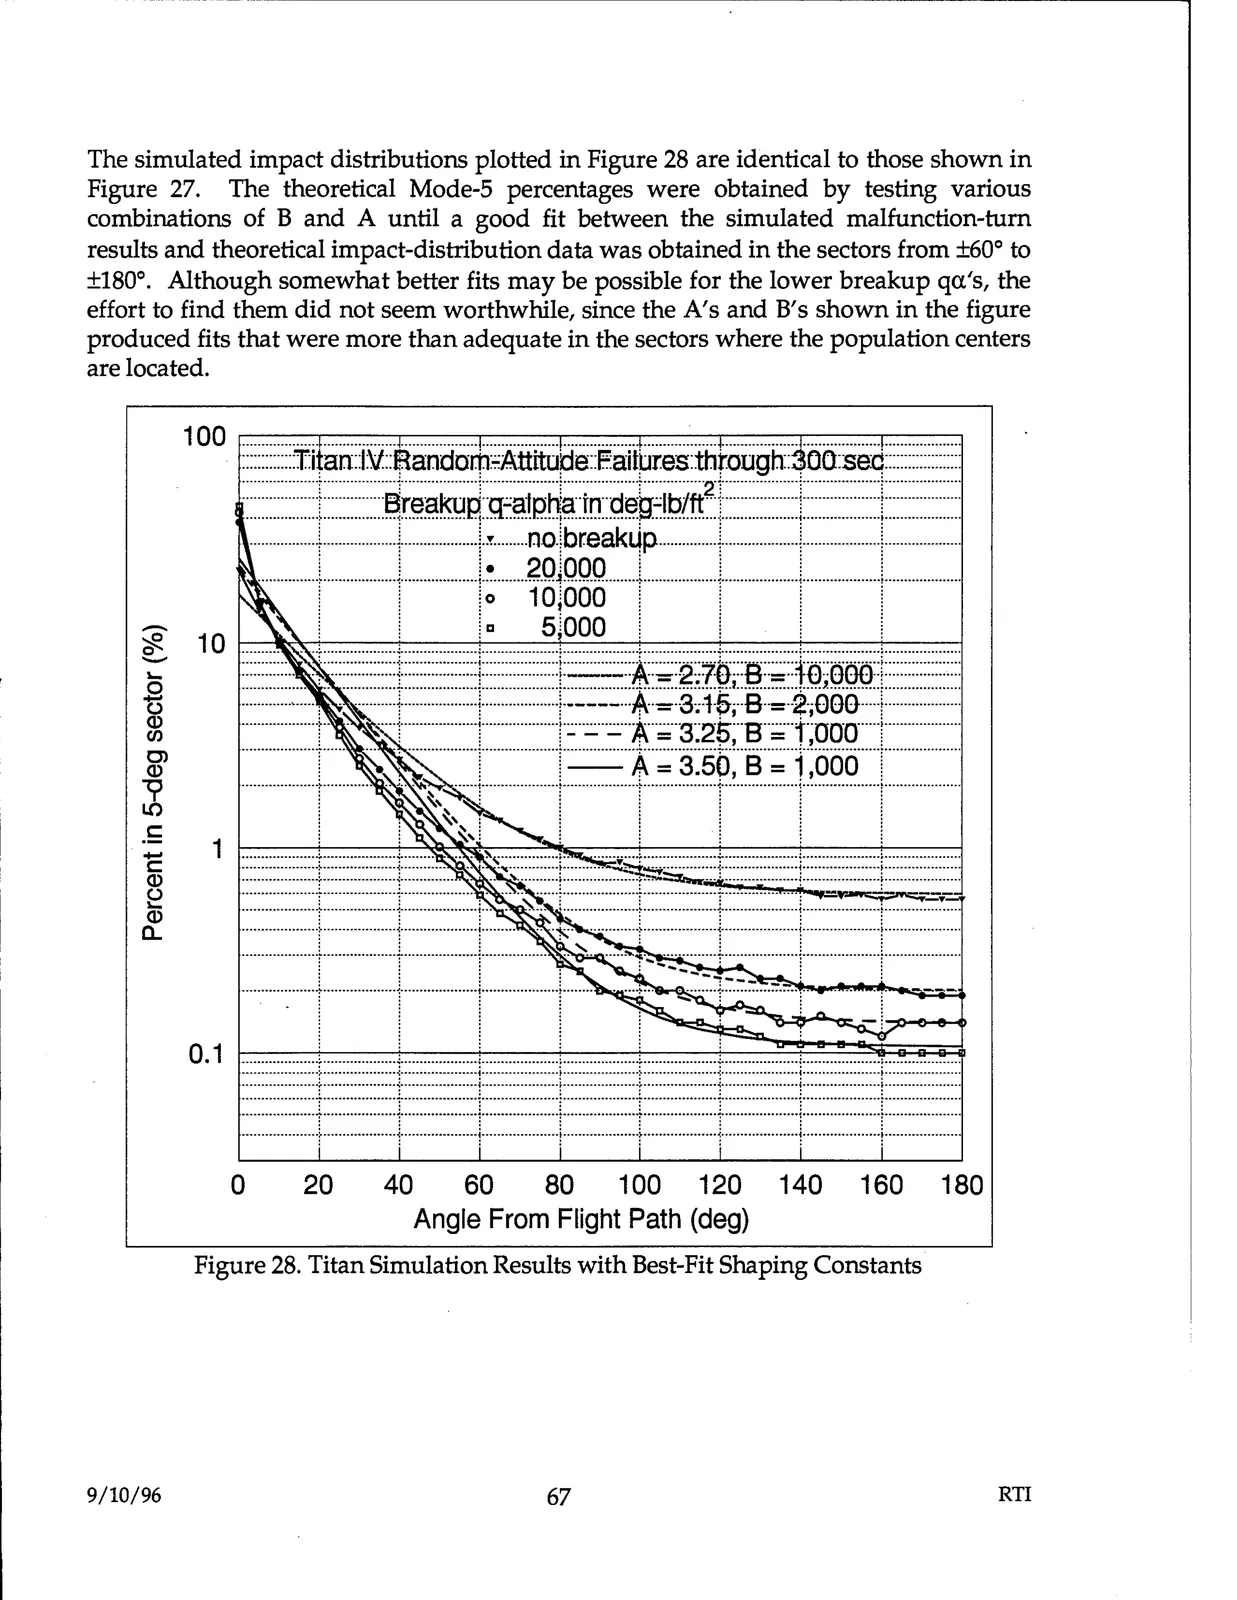
The simulated impact distributions plotted in Figure 28 are identical to those shown in Figure 27. The theoretical Mode-5 percentages were obtained by testing various combinations of B and A until a good fit between the simulated malfunction-turn results and theoretical impact-distribution data was obtained in the sectors from ±60° to ±180°. Although somewhat better fits may be possible for the lower breakup qa's, the effort to find them did not seem worthwhile, since the A's and B's shown in the figure produced fits that were more than adequate in the sectors where the population centers are located. - - .....- .......................- .......................-.....- ....... 100 .-- .......... - .....-......--....-.....-...........-- .....-.....- ......--....-.....- - .....-.....-..................-.....-.--~-=-.- .....-......-,-- - - ....- .....-. · ::::::::::::::Titan::l:V::Randor:h-:=Attitude::Eaitures:thtough:::300:serl:::::::::::::::::::: 2 I j -1 +eaku~~m~t:;~tlb/lt [ i ! ···1. 20!000 i ! i i ················: ···················1····················:···················~····················:···················,-···················:····················t···················· 1 1 :o 10j000 1 I 1 1 - i i iII siooo i I i I 10 t---1_____.,.._.--+---+-.--+-.--+-.----+-----1 '#- 1- 0 : ·:~::::::::1::::::::::::::::::J:::::::::::::A:- :2.1~,::a~~=Ja~ooo:~c:::::::::::::·::: t, -----··········+-················-+-----··-A·- 3.15,-·B··-2,00O···-+··················· Q) Cl) C) =+ ·· F l_::::=_=J~~:~H:gggf Q) ················----j------------ ------i---------- ---------·-·-;·-------- ··············1····················r····-······-·····- V LC) .5 ! I I I 1 ....................,................... ..,......... . ..............;....................,.................... C: Q) - ~ :::::::::::::::::::f:::::::::: : ::;~~~····:::::::::::::::s~~~=t:~~~=:: ····················r·····------- : ••••• ·-r········· : -----·-·--····1·······-------------t······-············· Q) ...................t············· i ·········1 '·················--t···················1····················i..-················· --------..--·······-r············--......... --------··········1········· ~........._ ·······~·········...........r................... a.. ···•·•••..··········~············--·········1···················· : : • I : I 0.1 I •••••••••••..•••••••.,,••••••••••••---.--•••••••••:••••••••u••••••••••:•••••..•••••• .......: ....••--.......•••••••••••••••••..•••••••••••••••••••..••••••••••••••••• • --·········••i••·······································~·················••-i•..···············••i••·····.............;.................... : ---+--·········~·········· ~ ··············: ····--.............t..·················i···········.........~ .................... : .........,...-··················· . ··············.········•..········.·--················.·······----·--..··--,···················· ....................!, .............--,..-·•······· ......... : : : ~ : ' i ! i ! ! ···················-r············--···--r------············· ···········--·······:·····...••••• ..····-r··············.....1....................~·················...t•••••••••••••••••••• 0 20 40 60 80 100 120 140 160 180 Angle From Flight Path (deg) Figure 28. Titan Simulation Results with Best-Fit Shaping Constants 9/10/96 67 RTI