Department of the Air Force Report, 1996
DOW-UAP-D048 · page 79 of 181
Text
This text came with the file. It may have mistakes. When the text and the image disagree, the image is right.
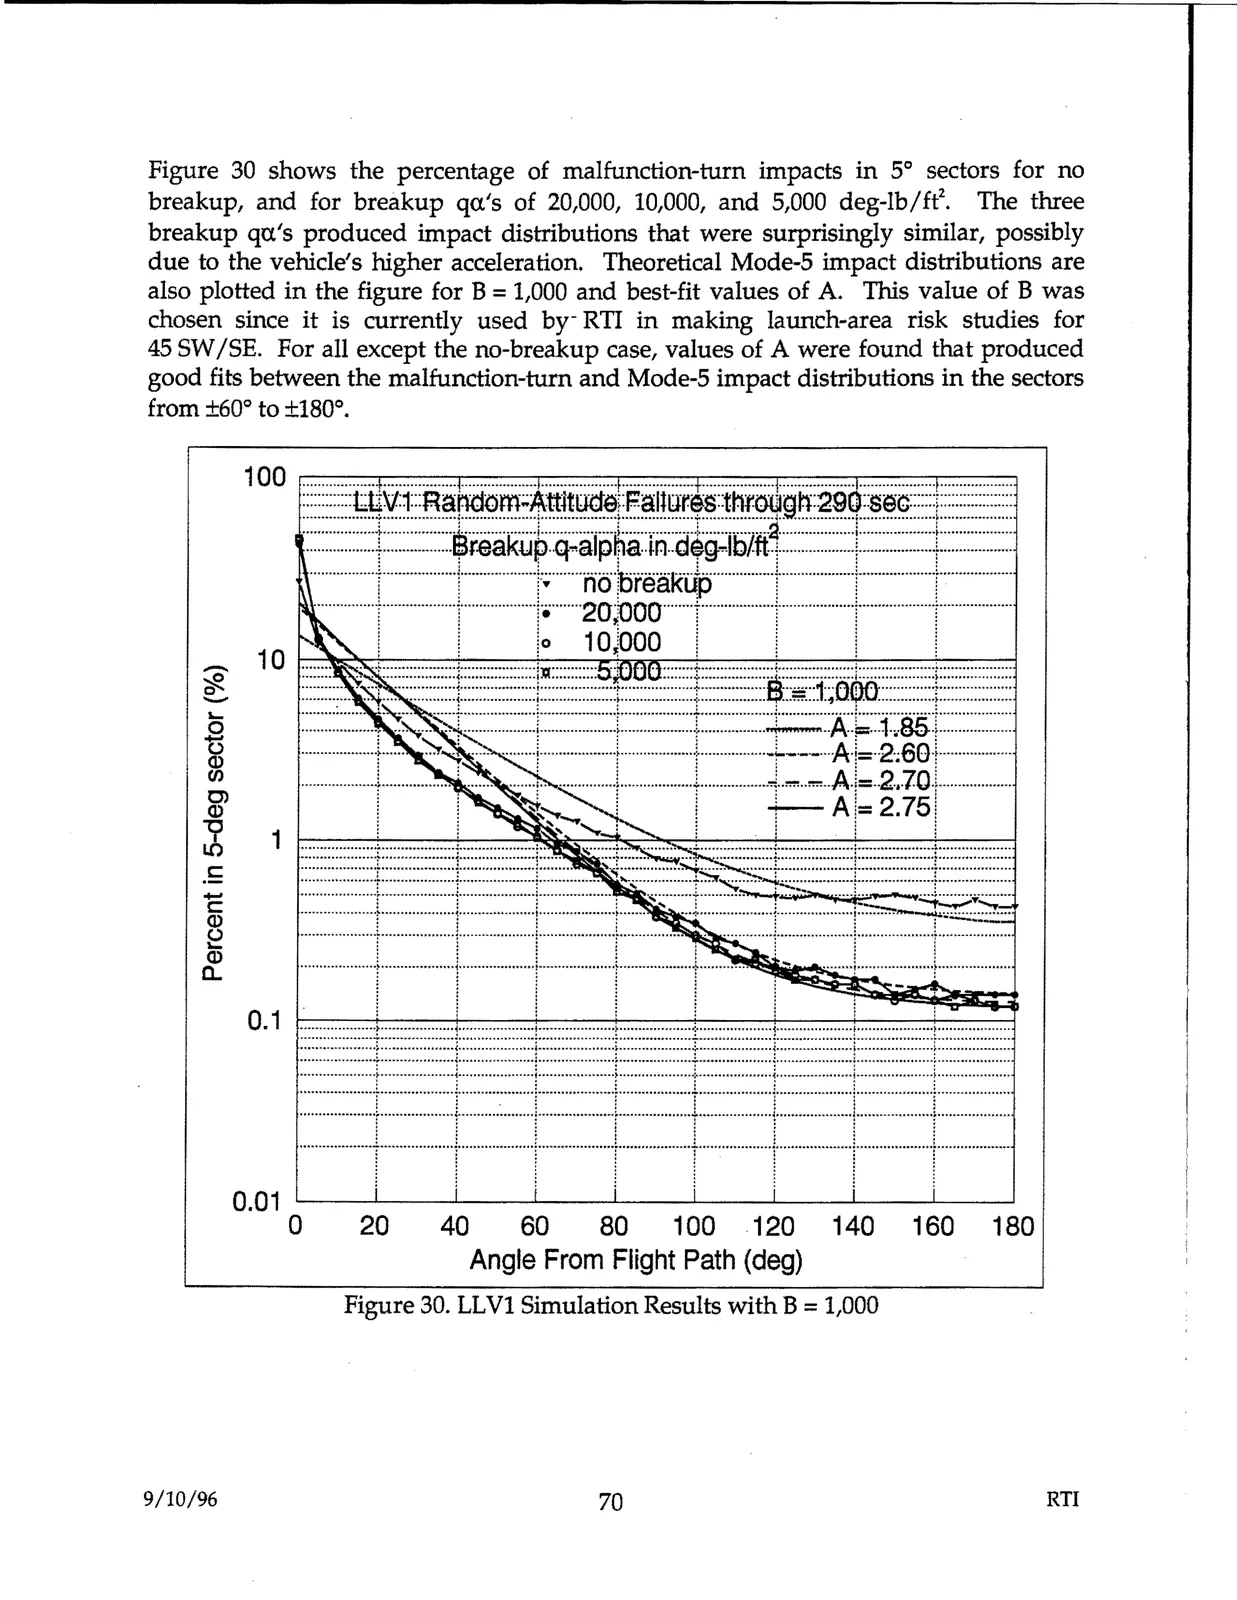
Figure 30 shows the percentage of malfunction-tum impacts in 5° sectors for no
breakup, and for breakup qa.'s of 20,000, 10,000, and 5,000 deg-lb/ft'\ The three
breakup qa's produced impact distributions that were surprisingly similar, possibly
due to the vehicle's higher acceleration. Theoretical Mode-5 impact distributions are
also plotted in the figure for B= 1,000 and best-fit values of A. This value of B was
chosen since it is currently used by-RTI in making launch-area risk studies for
45 SW/SE. For all except the no-breakup case, values of A were found that produced
good fits between the malfunction-tum and Mode-5 impact distributions in the sectors
from ±60° to ±180°.
1 00 r=
...............
::::::::=....:r.::....=.....:::.....:::
.....:r.:::
....:::
.....:::
....=,...:i::...=...=:..:::::
.....:::r.:....:::::
.....:::::
.....=. ....:::i::+=--=--·=·····:::::r.: .....:::
....:::::.... :::::.....:::::....
....:::....:::::::i:::::::::.....::::;.....:::::.....::::i
:::::::::::::~~v1:::R~~~;;,~J~!¥.!~;:f1~!!~r-,s::thf.o:l¥.9.~:~..!~~~::::::I:::::::::::::::::::
•..................t..................Sr.eakyp.q..alp~a..i11..dikrlb/.fd..........•••••••..!·········...........t...................
~-- .....[..
*· ~g~a.Rf
1..........
I i
!
/
1°
10:,000 !
/
/
~
....~::--..-
__
...•-
-........
..J~
....
~ 10 ~
...~
.....~.:......~
.•~-._-:::-)~L.-
....-....-
••••,~.~
•••
----,·
...- ....-....~....-.:::~:::j~-:::-::::-:::.-
....~.L~=-~-~~
..~'---~-.~85-.~.,--....-....-.....~
..
!
···················1---7······· •• J.
../..
l ·····t= ~i:1~~/
.
···
Q)
1
~ :
A,-2.75:
1
~
1 ................... :
:••••••••
!>!>
......
I
j ....
:
!...................
C:
:::::::::::::::::::1::......,.,...,.m••••1:::::::::••••~:;:-=...J-~~~
::::,,,,, i
••••••••~:::::::::::::::::::
C: -
~
Q)
::~~=::t !:::::i=:::::··l···· !
a.
I =~·····!···.....··~=
.......,;--U::-::::.......,:::1i--::::-::::-:::::-::::--l:::!-::::-::::-::::-:::::-;:::r-::::-::::-::::-::::--I:::
0.1
•••
..... ....
-••••-........i-
........-...... ....-....-.
♦♦♦ ,.._t............
- - -..
t----
..-··•••-••••----+-t••-,>,>,o,0-,0,0~~--H--H•O;+--
- ....
.............H•n••· 1♦ hU,....u••········~··················..•··.............h ••••••~ ................... : -···········{·················......i.......................~ .................. .
••••• ....•••u••n•• :••••••••..••••• .......... : ....•••••••••••••••Ha:a.. unonn>•h••••.: •UHHH<<••••> ♦ ..•: • ► o.eHOeH••••••••• : .. ,,,ouHOHo......: ......••••••• .. •••••••: ••• .. • .. •<HH ♦♦♦ .. ..
::: :::::::=[~:[::::~=:[:::= ::F=T-=::::J=l"=:::::I =
•
'
i
•
•
'
•
'
0.01
0
20
40
60
80
100
120
140
160
180
Angle From Flight Path (deg)
Figure 30. LLVl Simulation Results with B = 1,000
9/10/96
70
RTI