Department of the Air Force Report, 1996
DOW-UAP-D048 · page 80 of 181
Text
A machine read this text from the scan. When the text and the image disagree, the image is right.
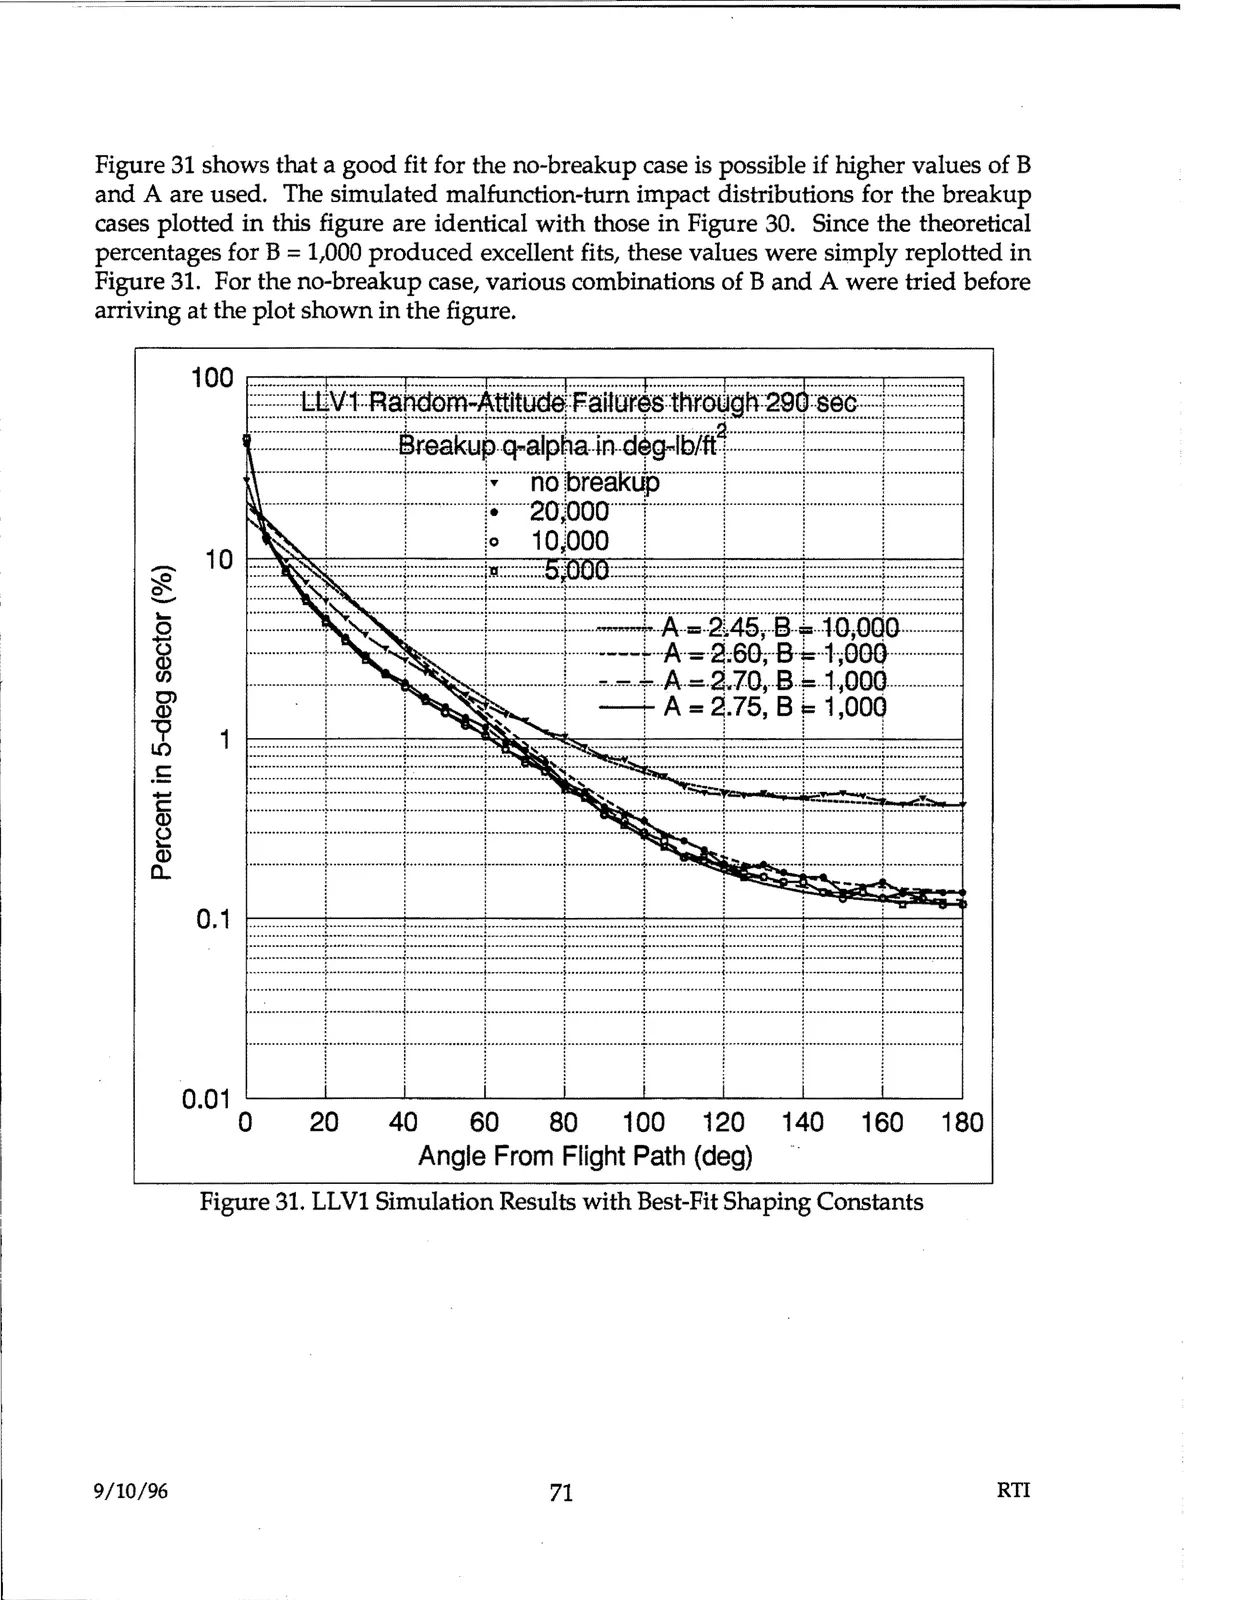
Figure 31 shows that a good fit for the no-breakup case is possible if higher values of B and A are used. The simulated malfunction-turn impact distributions for the breakup cases plotted in this figure are identical with those in Figure 30. Since the theoretical percentages for B = 1,000 produced excellent fits, these values were simply replotted in Figure 31. For the no-breakup case, various combinations of B and A were tried before arriving at the plot shown in the figure.

Figure 31. LLV1 Simulation Results with Best-Fit Shaping Constants

9/10/96

71

RTI