Department of the Air Force Report, 1996
DOW-UAP-D048 · page 84 of 181
Text
This text came with the file. It may have mistakes. When the text and the image disagree, the image is right.
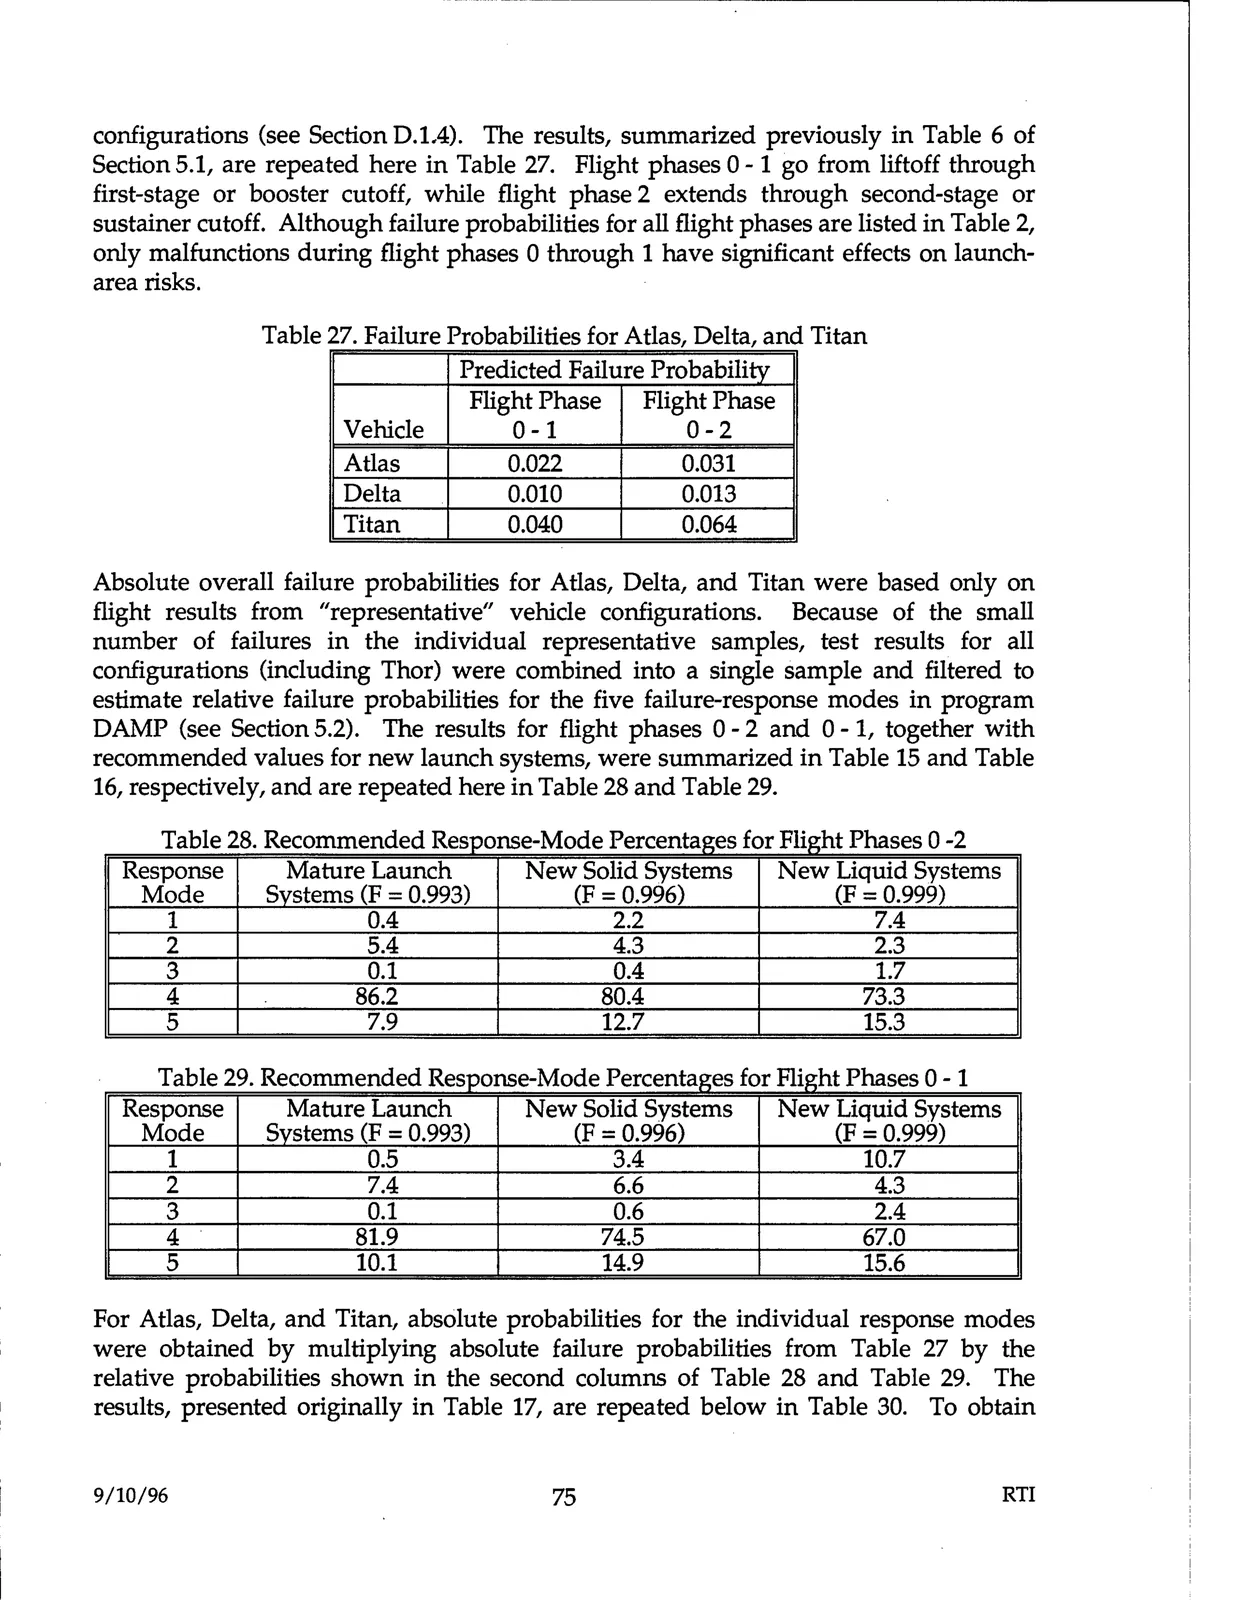
configurations (see Section D.1.4). The results, summarized previously in Table 6 of
Section 5.1, are repeated here in Table 27. Flight phases 0 - 1 go from liftoff through
first-stage or booster cutoff, while flight phase 2 extends through second-stage or
sustainer cutoff. Although failure probabilities for all flight phases are listed in Table 2,
only malfunctions during flight phases Othrough 1 have significant effects on launch-
area risks.
Table 27. Failure Probabilities for Atlas, Delta, and Titan
Predicted Failure Probabili
Vehicle
Flight Phase
O - 1
Flight Phase
0 - 2
Atlas
Delta
Titan
0.022
0.010
0.040
0.031
0.013
0.064
Absolute overall failure probabilities for Atlas, Delta, and Titan were based only on
flight results from "representative" vehicle configurations.
Because of the small
number of failures in the individual representative samples, test results for all
configurations (including Thor) were combined into a single sample and filtered to
estimate relative failure probabilities for the five failure-response modes in program
DAMP (see Section 5.2). The results for flight phases O - 2 and O - 1, together with
recommended values for new launch systems, were summarized in Table 15 and Table
16, respectively, and are repeated here in Table 28 and Table 29.
Table 28. Recommended Res onse-Mode Percenta es for Fli ht Phases O-2
Response
Mature Launch
New Solid Systems
New Liquid Systems
Mode
S stems (F = 0.993)
(F = 0.996)
(F = 0.999)
1
0.4
2.2
7.4
2
5.4
4.3
2.3
3
0.1
0.4
1.7
4
86.2
80.4
73.3
5
7.9
12.7
15.3
Table 29. Recommended Res
Response
Mode
1
2
3
4
5
Mature Launch
S stems (F = 0.993)
0.5
7.4
0.1
81.9
10.1
New Solid Systems
New Liquid Systems
(F = 0.996)
(F = 0.999)
3.4
10.7
6.6
4.3
0.6
2.4
74.5
67.0
14.9
15.6
For Atlas, Delta, and Titan, absolute probabilities for the individual response modes
were obtained by multiplying absolute failure probabilities from Table 27 by the
relative probabilities shown in the second columns of Table 28 and Table 29. The
results, presented originally in Table 17, are repeated below in Table 30. To obtain
9/10/96
75
RTI