Department of the Air Force Report, 1996
DOW-UAP-D048 · page 85 of 181
Text
This text came with the file. It may have mistakes. When the text and the image disagree, the image is right.
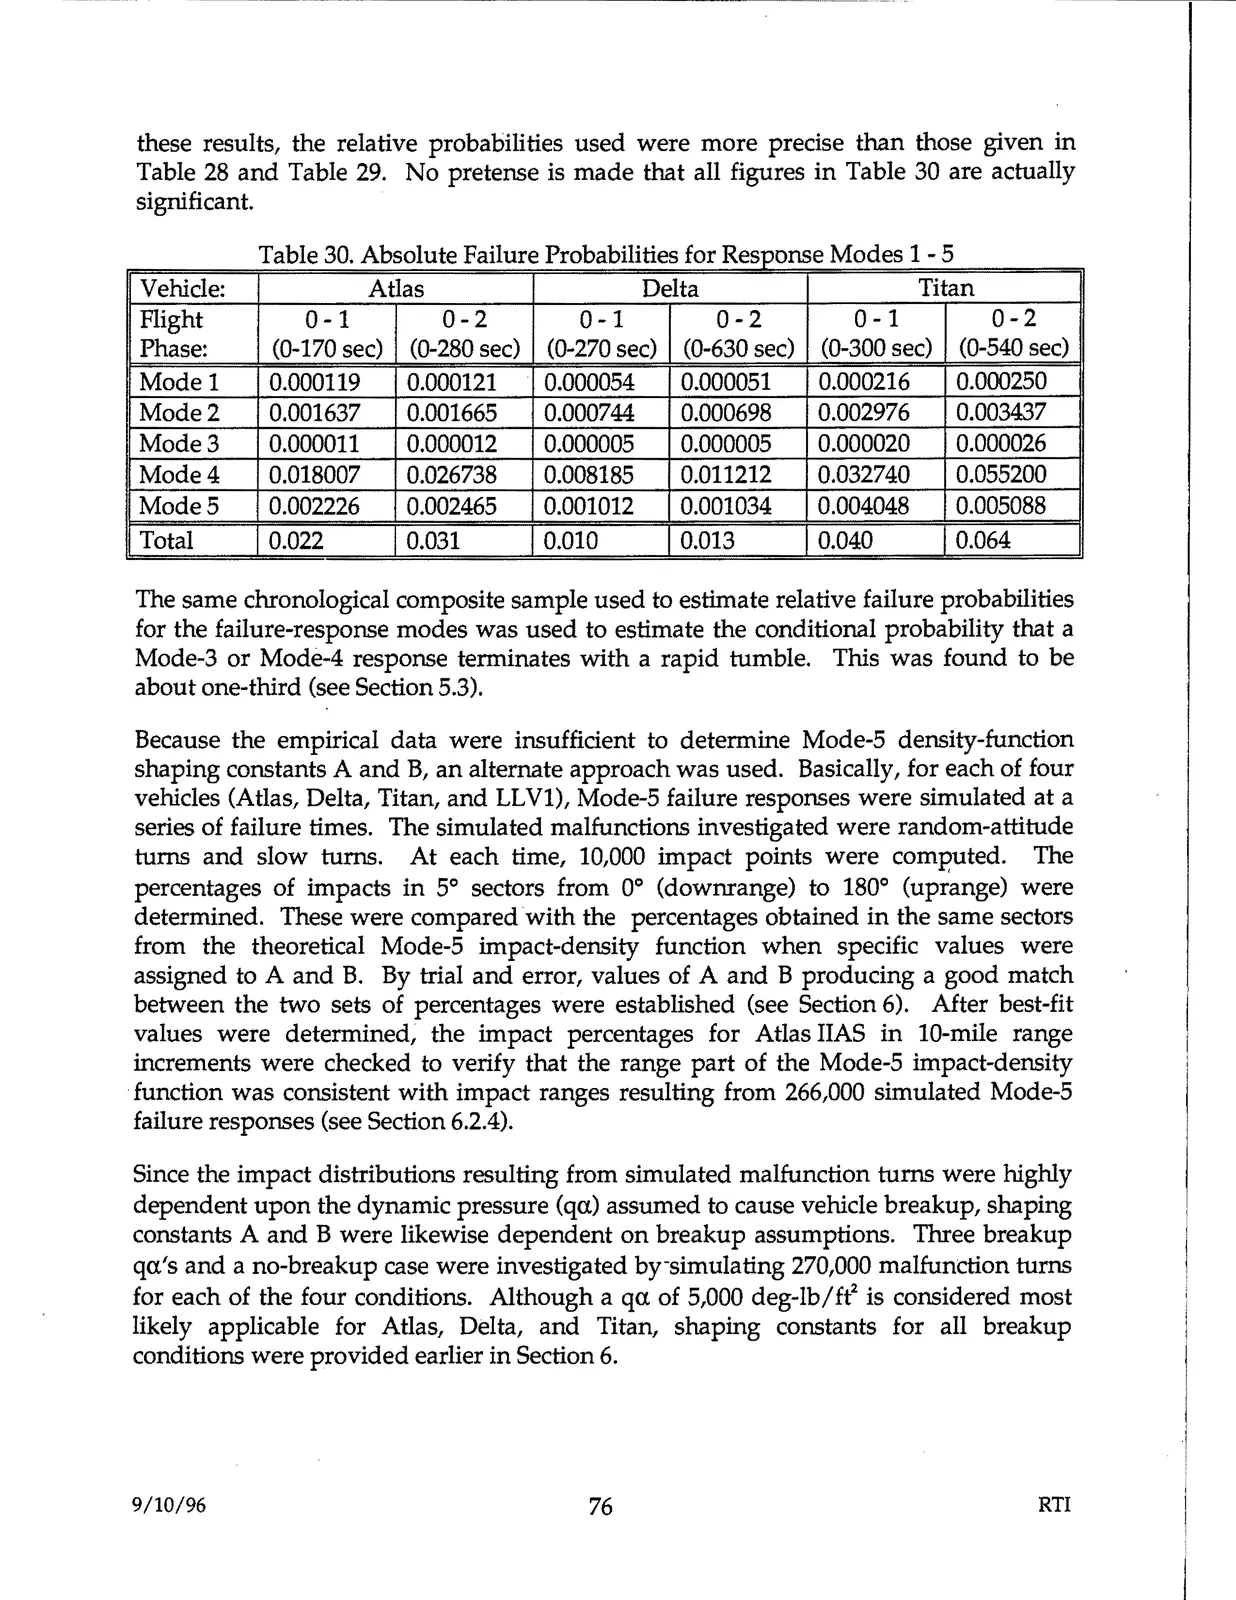
these results, the relative probabilities used were more precise than those given in
Table 28 and Table 29. No pretense is made that all figures in Table 30 are actually
significant.
Table 30. Absolute Failure Probabilities for Response Modes 1 - 5
Vehicle:
Atlas
Delta
0-1
0-2
(0-270 sec)
(0-630 sec)
Titan
0-1
0-2
(0-300 sec)
(0-540 sec)
Flight
Phase:
0-1
(0-170 sec)
0-2
(0-280 sec)
Model
0.000119
0.000121
0.000054
0.000051
0.000216
0.000250
0.003437
Mode2
Mode3
0.001637
0.000011
0.001665
0.000744
0.000698
0.002976
0.000012
0.000005
0.000005
0.000020
0.000026
Mode4
0.018007
0.026738
0.008185
0.011212
0.001012
0.001034
0.032740
0.004048
0.055200
0.005088
Mode5
0.002226
0.002465
Total
0.022
0.031
0.010
0.013
nn11n
0.064
The same chronological composite sample used to estimate relative failure probabilities
for the failure-response modes was used to estimate the conditional probability that a
Mode-3 or Mode-4 response terminates with a rapid tumble. This was found to be
about one-third (see Section 5.3).
Because the empirical data were insufficient to determine Mode-5 density-function
shaping constants A and B, an alternate approach was used. Basically, for each of four
vehicles (Atlas, Delta, Titan, and LLVl), Mode-5 failure responses were simulated at a
series of failure times. The simulated malfunctions investigated were random-attitude
turns and slow turns. At each time, 10,000 impact points were computed. The
percentages of impacts in 5° sectors from 0° (downrange) to 180° (uprange) were
determined. These were compared with the percentages obtained in the same sectors
from the theoretical Mode-5 impact-density function when specific values were
assigned to A and B. By trial and error, values of A and B producing a good match
between the two sets of percentages were established (see Section 6). After best-fit
values were determined, the impact percentages for Atlas HAS in 10-mile range
increments were checked to verify that the range part of the Mode-5 impact-density
function was consistent with impact ranges resulting from 266,000 simulated Mode-5
failure responses (see Section 6.2.4).
Since the impact distributions resulting from simulated malfunction turns were highly
dependent upon the dynamic pressure (qa) assumed to cause vehicle breakup, shaping
constants A and B were likewise dependent on breakup assumptions. Three breakup
qa's and a no-breakup case were investigated by-simulating 270,000 malfunction turns
for each of the four conditions. Although a qa of 5,000 deg-lb/ft2 is considered most
likely applicable for Atlas, Delta, and Titan, shaping constants for all breakup
conditions were provided earlier in Section 6.
9/10/96
76
RTI