Department of the Air Force Report, 1996
DOW-UAP-D048 · page 95 of 181
Text
This text came with the file. It may have mistakes. When the text and the image disagree, the image is right.
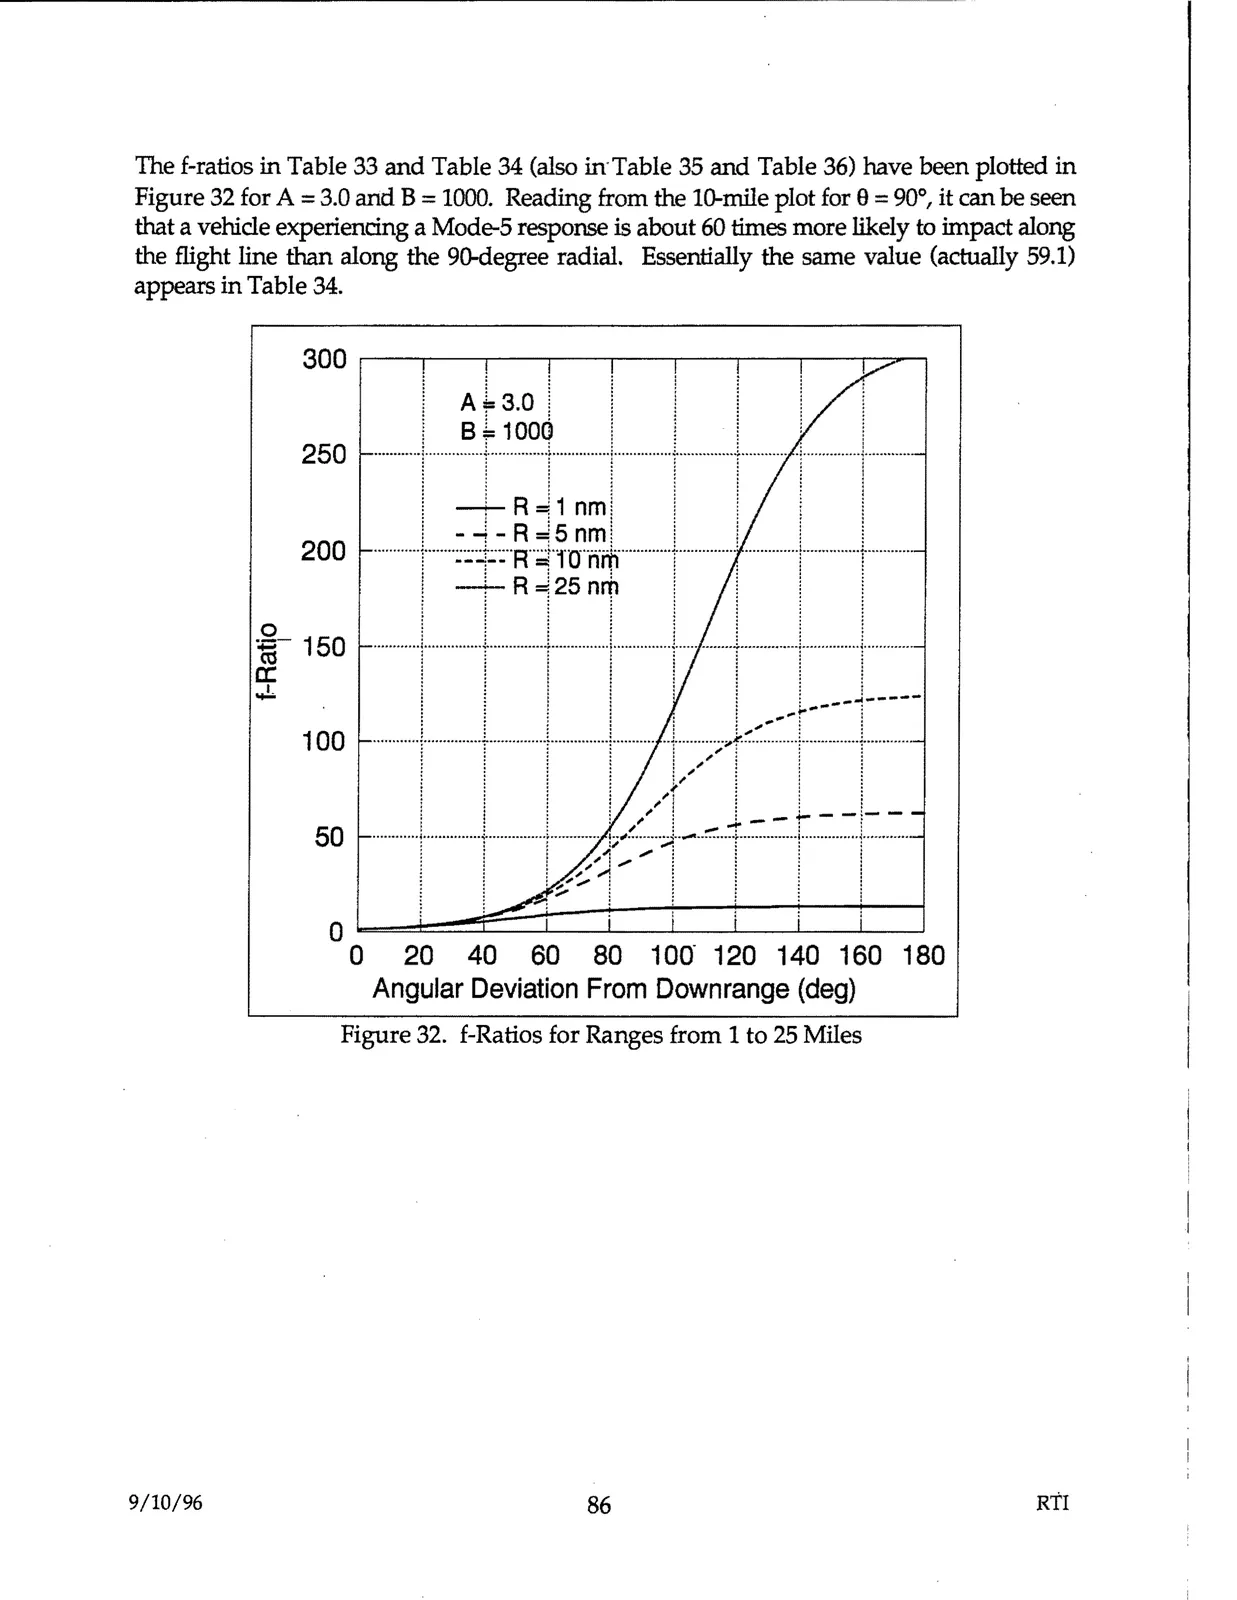
The £-ratios in Table 33 and Table 34 (also in·Table 35 and Table 36) have been plotted in
Figure 32 for A =3.0 arid B =1000. Reading from the 10-mile plot for 8 = 90°, it can be seen
that a vehicle experiencing a Mode-5 response is about 60 times more likely to impact along
the flight line than along the 90-degree radial. Essentially the same value (actually 59.1)
appears in Table 34.
300 ,---,.----,------,---.--,-----.----,-----r-~
15
0
a:
..,!..
250
200
150
Figure 32. £-Ratios for Ranges from 1 to 25 Miles
9/10/96
86
RTI