Department of the Air Force Report, 1996
DOW-UAP-D048 · page 96 of 181
Text
This text came with the file. It may have mistakes. When the text and the image disagree, the image is right.
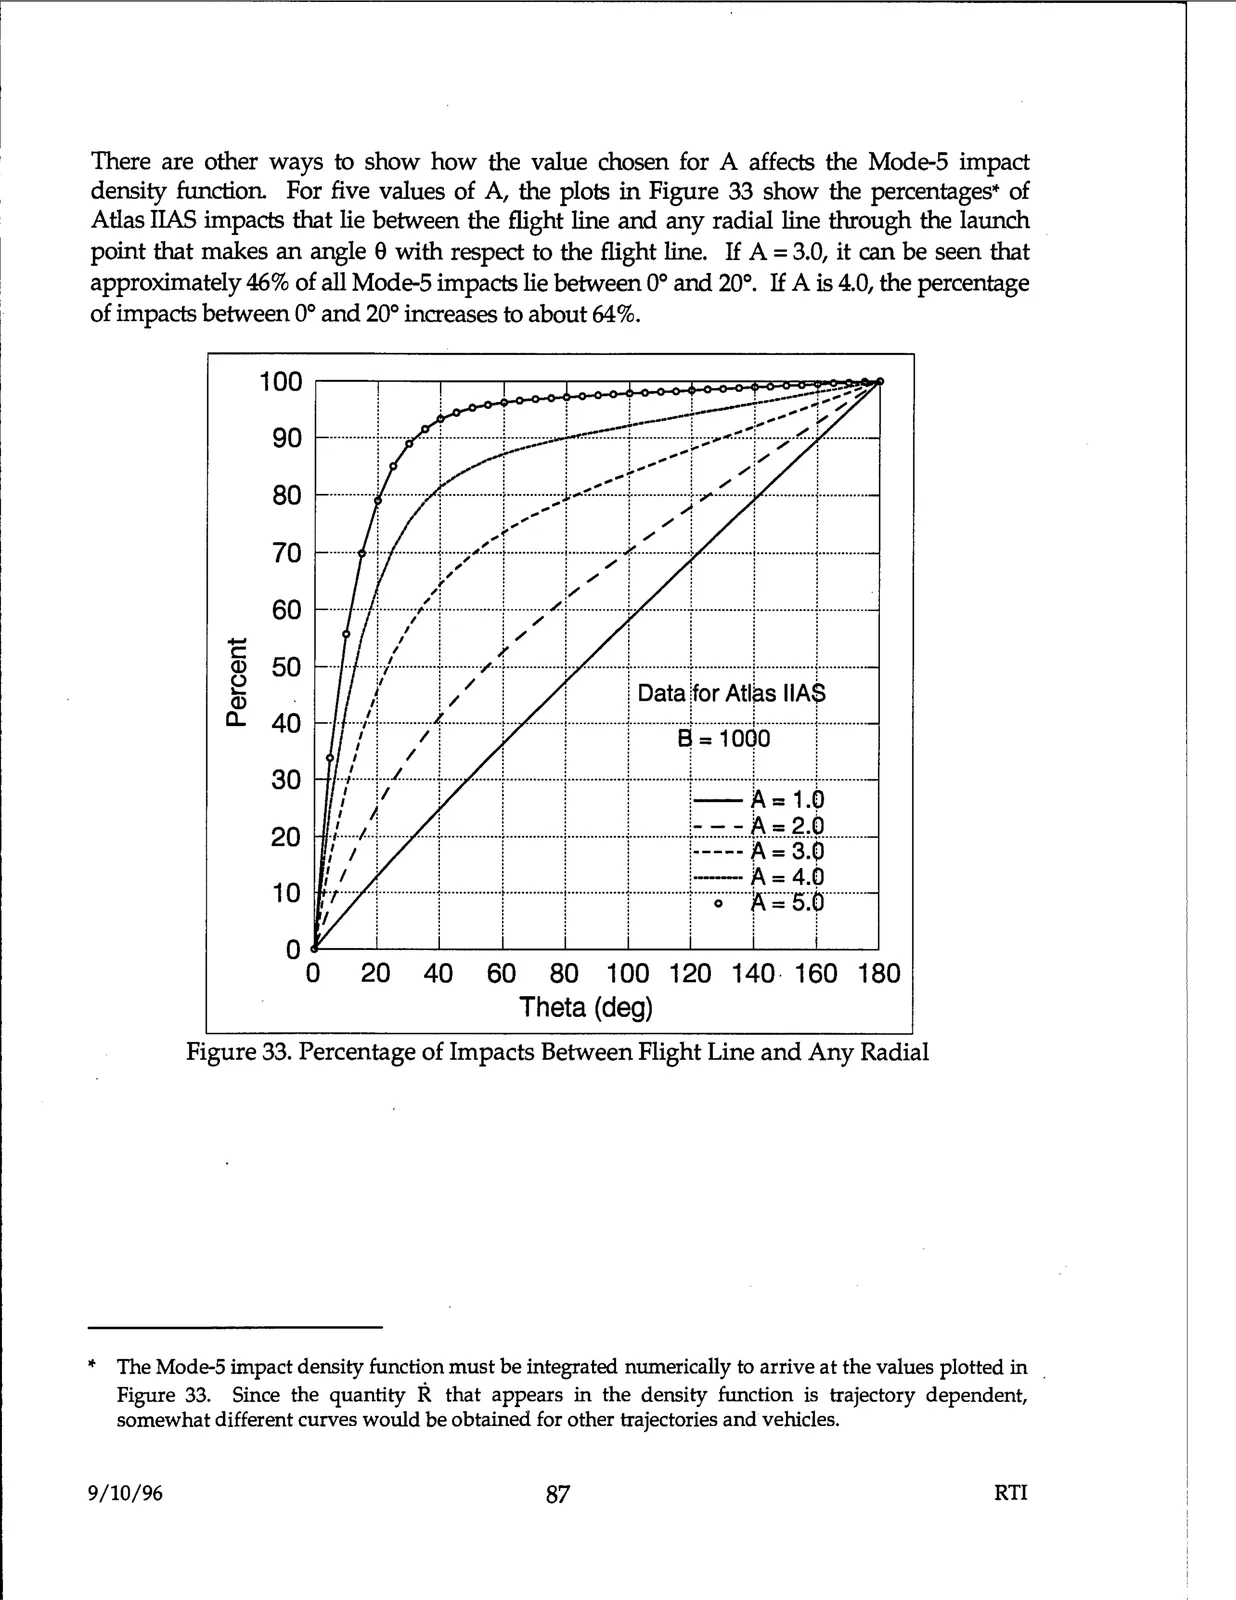
There are other ways to show how the value chosen for A affects the Mode-5 impact density function For five values of A, the plots in Figure 33 show the percentages* of Atlas IIAS impacts that lie between the flight line and any radial line through the launch point that makes an angle 8 with respect to the flight line. If A = 3.0, it can be seen that approximately 46% of all Mode-5 impacts lie between 0° and 20°. If A is 4.0, the percentage of impacts between 0° and 20° increases to about 64%. 100 ..J..-.-- ..;,,-.......r ..: ......r......... 90 :.-, 80 70 60 C - (I) e 50 (I) ,f ' ! / ! 1 !Data jfor Atl. s IIA~ a.. .... ,'.j..............,r ............. ;............;...............;.............. !...............i...............;............ 40 : / i ' : : 8 = 1 000 i 30 /J/ I ! I j i-~=1-~ , , , - - - = 2.u 20 r·•,l-r•····· ••••••••••••••••••••••••• • •••••••••••••••••••••••• -----~ =·3.()·········· / 1 : ; ; . , --- A= 4.() 10 O / 1 r I r r= 5·~ 0 0 20 40 60 80 100 120 140· 160 180 Theta (deg) Figure 33. Percentage of Impacts Between Flight Line and Any Radial ············~ ·············· l : ---: ...... -t-/. ; * The Mode-5 impact density function must be integrated numerically to arrive at the values plotted in Figure 33. Since the quantity R that appears in the density function is trajectory dependent, somewhat different curves would be obtained for other trajectories and vehicles. 9/10/96 87 RTI