Department of the Air Force Report, 1996
DOW-UAP-D048 · page 97 of 181
Text
This text came with the file. It may have mistakes. When the text and the image disagree, the image is right.
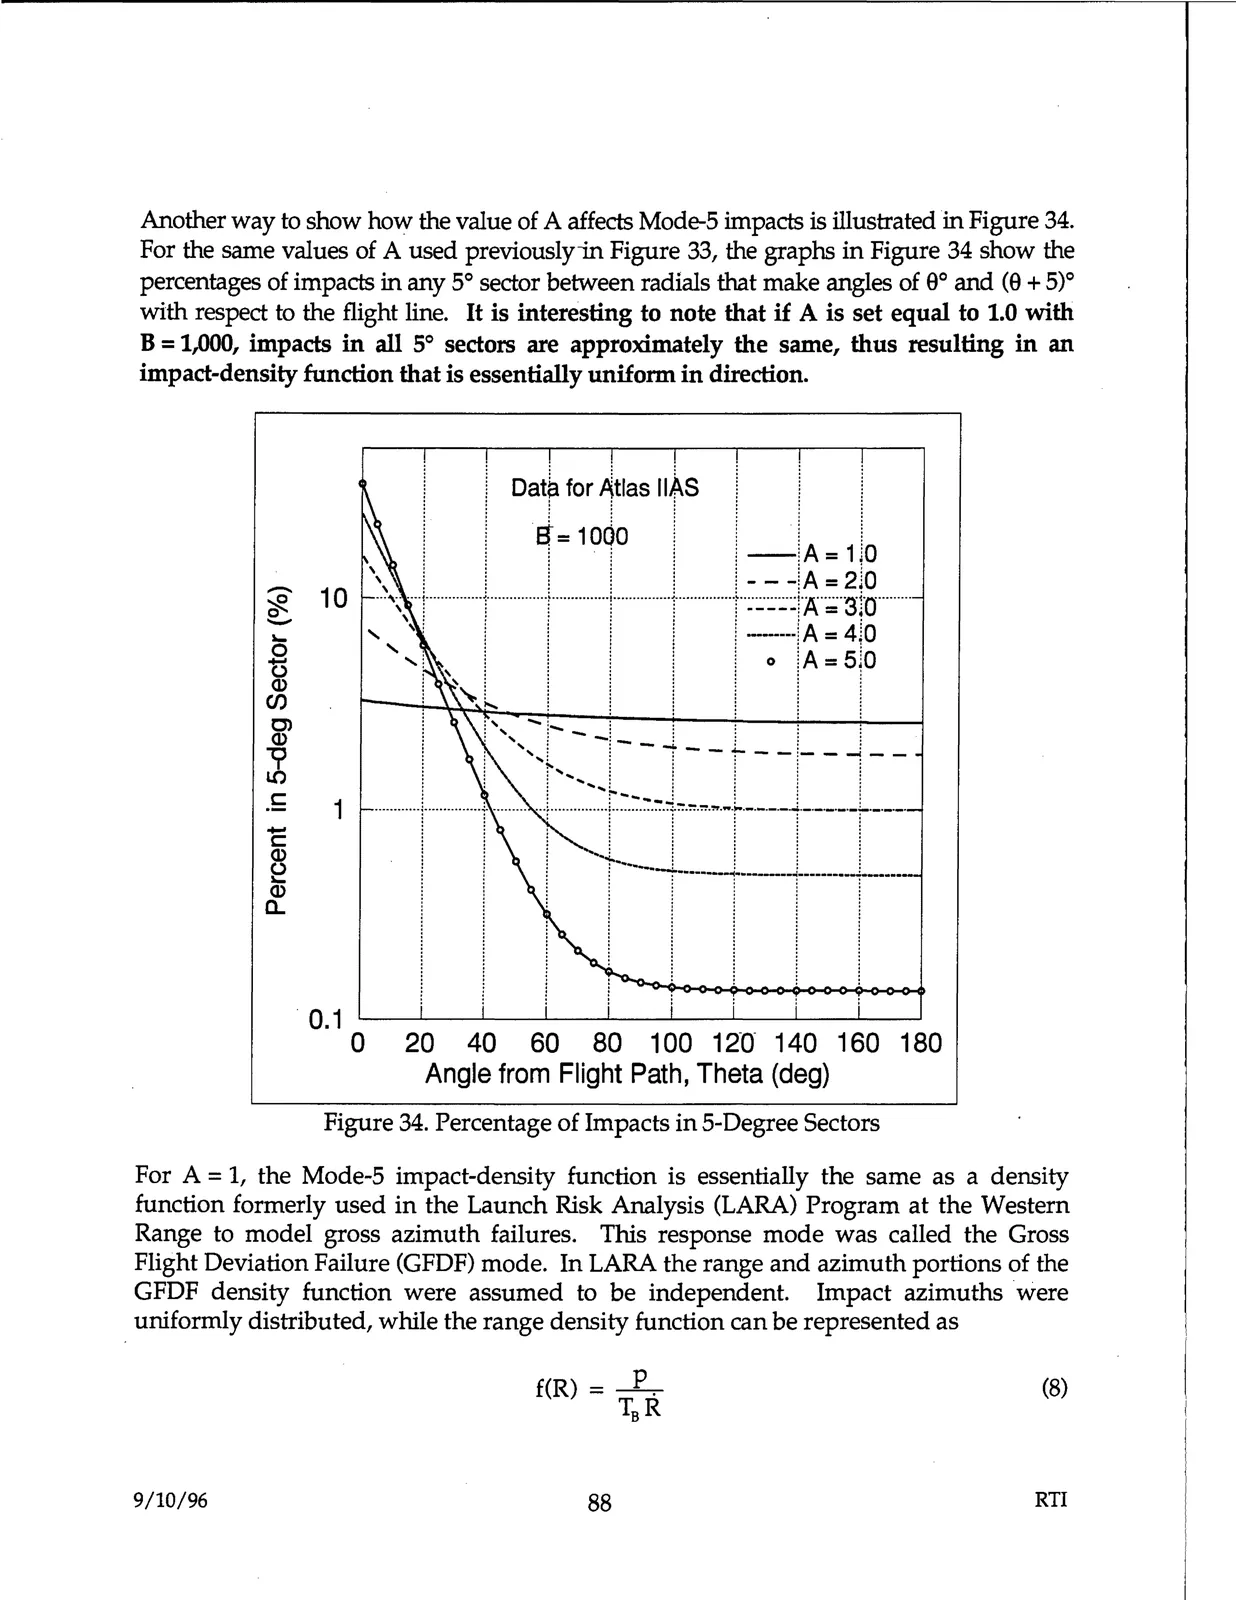
Another way to show how the value of A affects Mode-5 impacts is illustrated in Figure 34.
For the same values of A used previouslyin Figure 33, the graphs in Figure 34 show the
percentages of impacts in any 5° sector between radials that make angles of 0° and (0 + 5)0
with respect to the flight line. It is interesting to note that if A is set equal to 1.0 with
B = 1,000, impacts in all 5° sectors are approximately the same, thus resulting in an
impact-density function that is essentially uniform in direction.
1, .
Oat~ for Atlas IIAS
!
J
I
=10Jo
1
!,:
,
,
1
-iA =1 0
'
.
.
l.
.l
.1
- - -!.A = 2 0
.
~ 10
e....
\ l l
• I
r
i -----jA = 3jo
...
,
,
1
---···,A= 4•0
0 0
'
I
I
IA = sJo
Q)
en
C)
Q)
~
C
1
c
~
Q)
a..
0.1
, , ,,
o
~l
i
I
!
0
20
40
60
80 100 12n 140 160 180
Angle from Flight Path, Theta (deg)
Figure 34. Percentage of Impacts in 5-Degree Sectors
For A= 1, the Mode-5 impact-density function is essentially the same as a density
function formerly used in the Launch Risk Analysis (LARA) Program at the Western
Range to model gross azimuth failures. This response mode was called the Gross
Flight Deviation Failure (GFDF) mode. In LARA the range and azimuth portions of the
GFDF density function were assumed to be independent. Impact azimuths were
uniformly distributed, while the range density function can be represented as
(8)
9/10/96
88
RTI