AAWSAP DIRD, Space Access: Where We’ve Been and Where We Could Go, March 2010
DOW-UAP-D124 · page 25 of 56
Text
This text came with the file. It may have mistakes. When the text and the image disagree, the image is right.
UNCLASSIFIED/ /POR: err1e1J1tt U.!I!! Oflt I
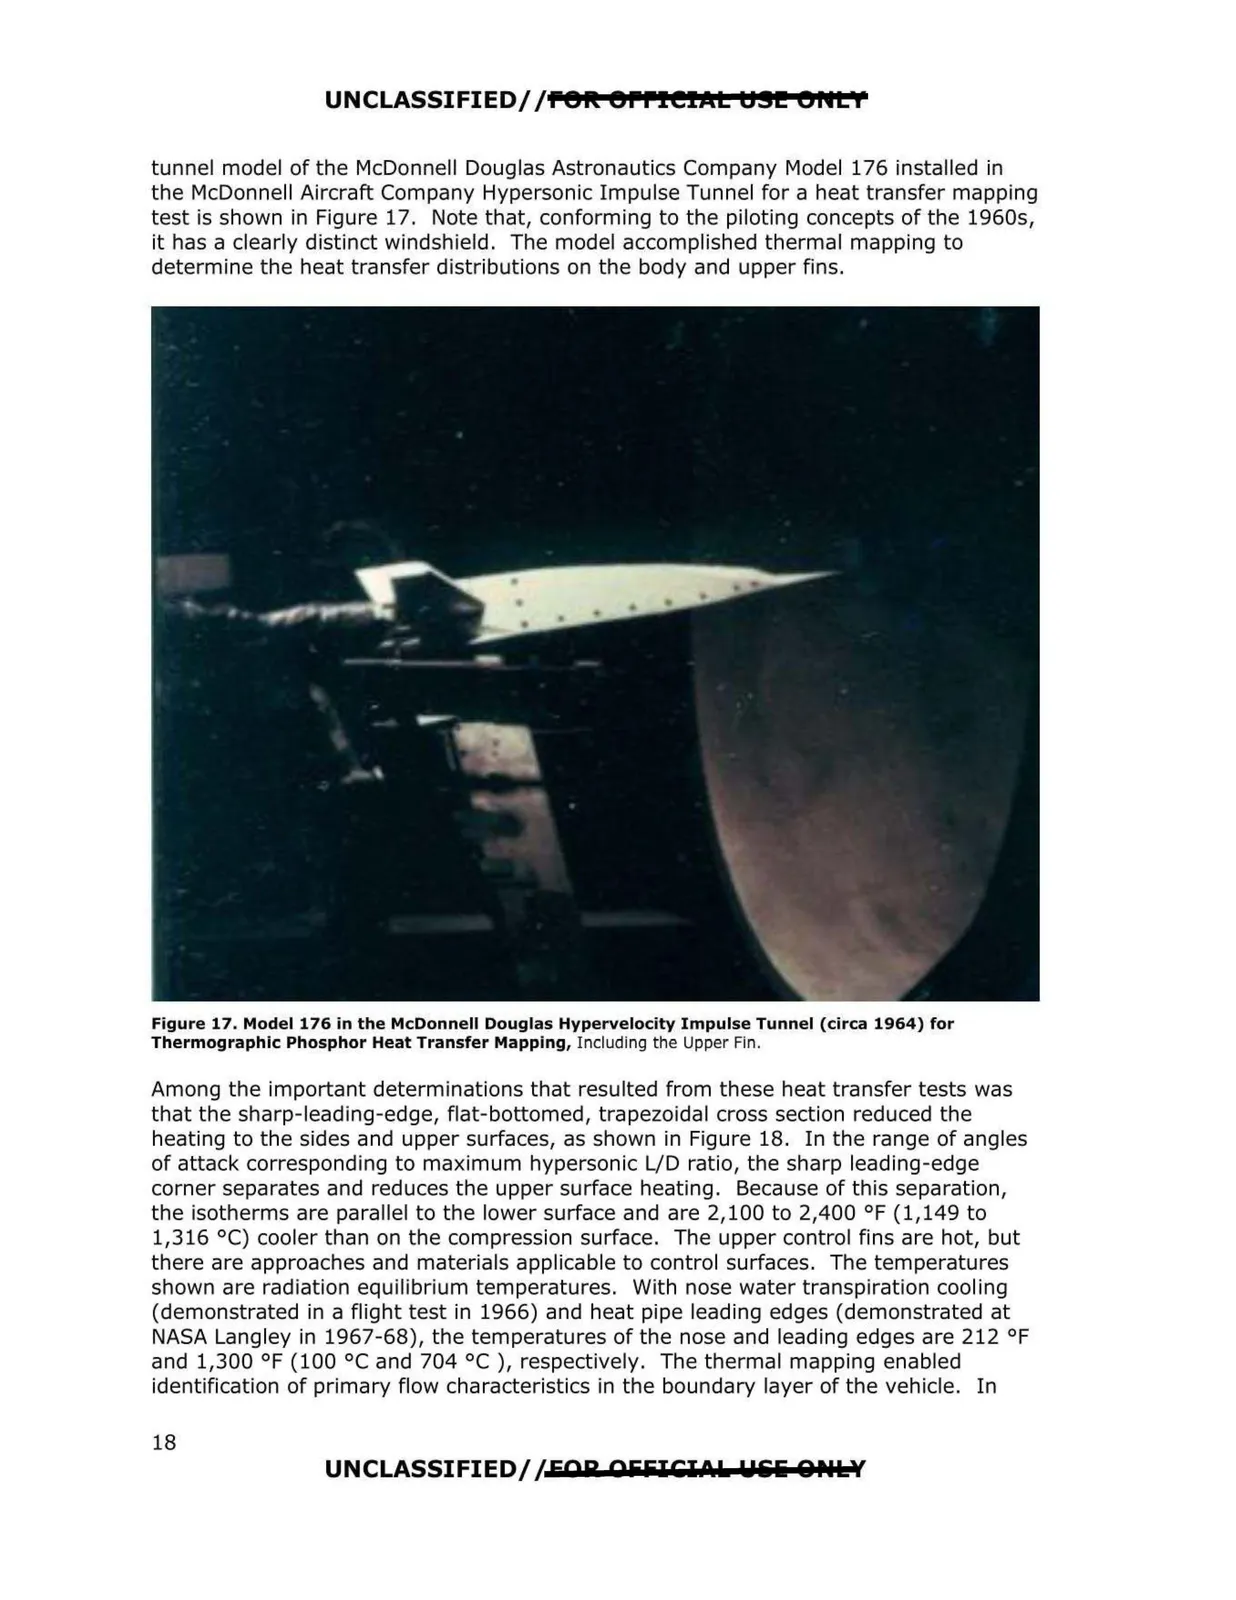
tunnel model of the McDonnell Douglas Astronautics Company Model 176 installed in
the McDonnell Aircra~ Company Hypersonic Impulse Tunnel for a heat transfer mapping
test is shown in Figure 17. Note that, conforming to the piloting concepts of the 1960s,
it has a clearly distinct windshield . The model accomplished thermal mapping to
determine the heat transfer distributions on the body and upper fins.
Figure 17. Model 176 in the McDonnell Douglas Hypervelocity Impulse Tunnel (circa 1964} for
Thermographic Phosphor Heat Transfer Mapping, Including the Upper Fin.
Among the important determinations that resulted from these heat transfer tests was
that the sharp-leading-edge, flat-bottomed, trapezoidal cross section reduced the
heating to the sides and upper surfaces, as shown in Figure 18. In the range of angles
of attack corresponding to maximum hypersonic L/D ratio, the sharp leading-edge
corner separates and reduces the upper surface heating. Because of this separation,
the isotherms are parallel to the lower surface and are 2,100 to 2,400 °F (1,149 to
1,316 °C) cooler than on the compression surface. The upper control fins are hot, but
there are approaches and materials applicable to control surfaces. The temperatures
shown are radiation equilibrium temperatures. With nose water transpiration cooling
(demonstrated in a flight test in 1966) and heat pipe leading edges (demonstrated at
NASA Langley in 1967-68), the temperatures of the nose and leading edges are 212 °F
and 1,300 °F (100 °C and 704 °C ), respectively. The thermal mapping enabled
identification of primary flow characteristics in the boundary layer of the vehicle. In
UNCLASSIFIED//EAR OFFICIO I. Uliliii 0Ptllf
18