AAWSAP DIRD, Space Access: Where We’ve Been and Where We Could Go, March 2010
DOW-UAP-D124 · page 26 of 56
Text
This text came with the file. It may have mistakes. When the text and the image disagree, the image is right.
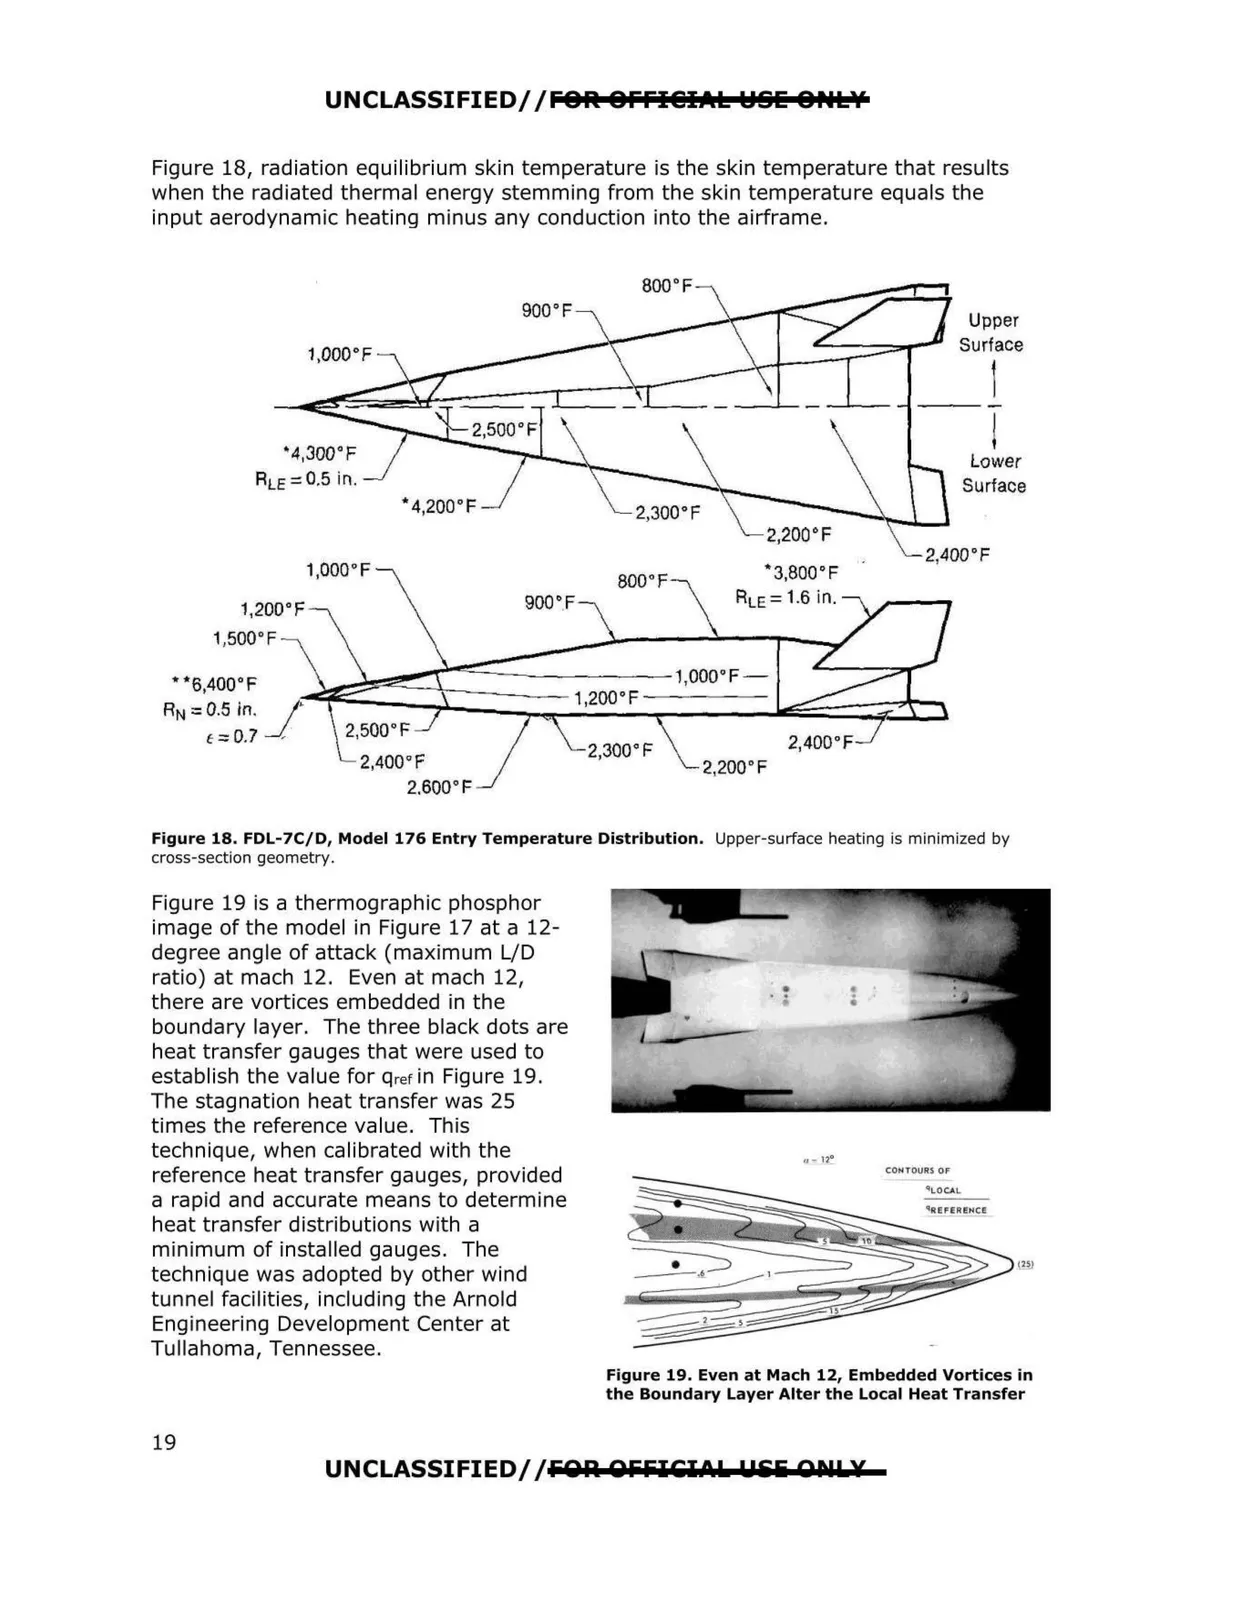
--- 1,200°F 1,500° F 800 °F " 3,800°F RLE=1.6 in. 2,200° F UNCLASSIFIED/ /FOR OFFI@IAL l:ISE OHL¥ Figure 18, radiation equilibrium skin temperature is the skin temperature that results when the radiated thermal energy stemming from the skin temperature equals the input aerodynamic heating minus any conduction into the airframe. 900 °F Upper Surface ! l •4,Joo°F Lower ALE= 0.5 in. Surface • 4,200°F 1,ooo·F Figure 18. FDL-7C/D, Model 176 Entry Temperature Distribution. Upper-surface heating is minimized by cross-section geometry. Figure 19 is a thermographic phosphor image of the model in Figure 17 at a 12 degree angle of attack (maximum L/D ratio) at mach 12. Even at mach 12, there are vortices embedded in the boundary layer. The three black dots are heat transfer gauges that were used to establish the value for qrefin Figure 19. The stagnation heat transfer was 25 times the reference value. This technique, when calibrated with the ,, - no reference heat transfer gauges, provided a rapid and accurate means to determine heat transfer distributions with a minimum of installed gauges. The technique was adopted by other wind tunnel facilities, including the Arnold Engineering Development Center at Tullahoma, Tennessee. Figure 19. Even at Mach 12, Embedded Vortices in the Boundary Layer Alter the Local Heat Transfer UNCLASSIFIED/ /FOR. OFFICI CIs. flili Qllls.¥ 19