AAWSAP DIRD, An Introduction to the Statistical Drake Equation, March 2010
DOW-UAP-D127 · page 16 of 55
Text
This text came with the file. It may have mistakes. When the text and the image disagree, the image is right.
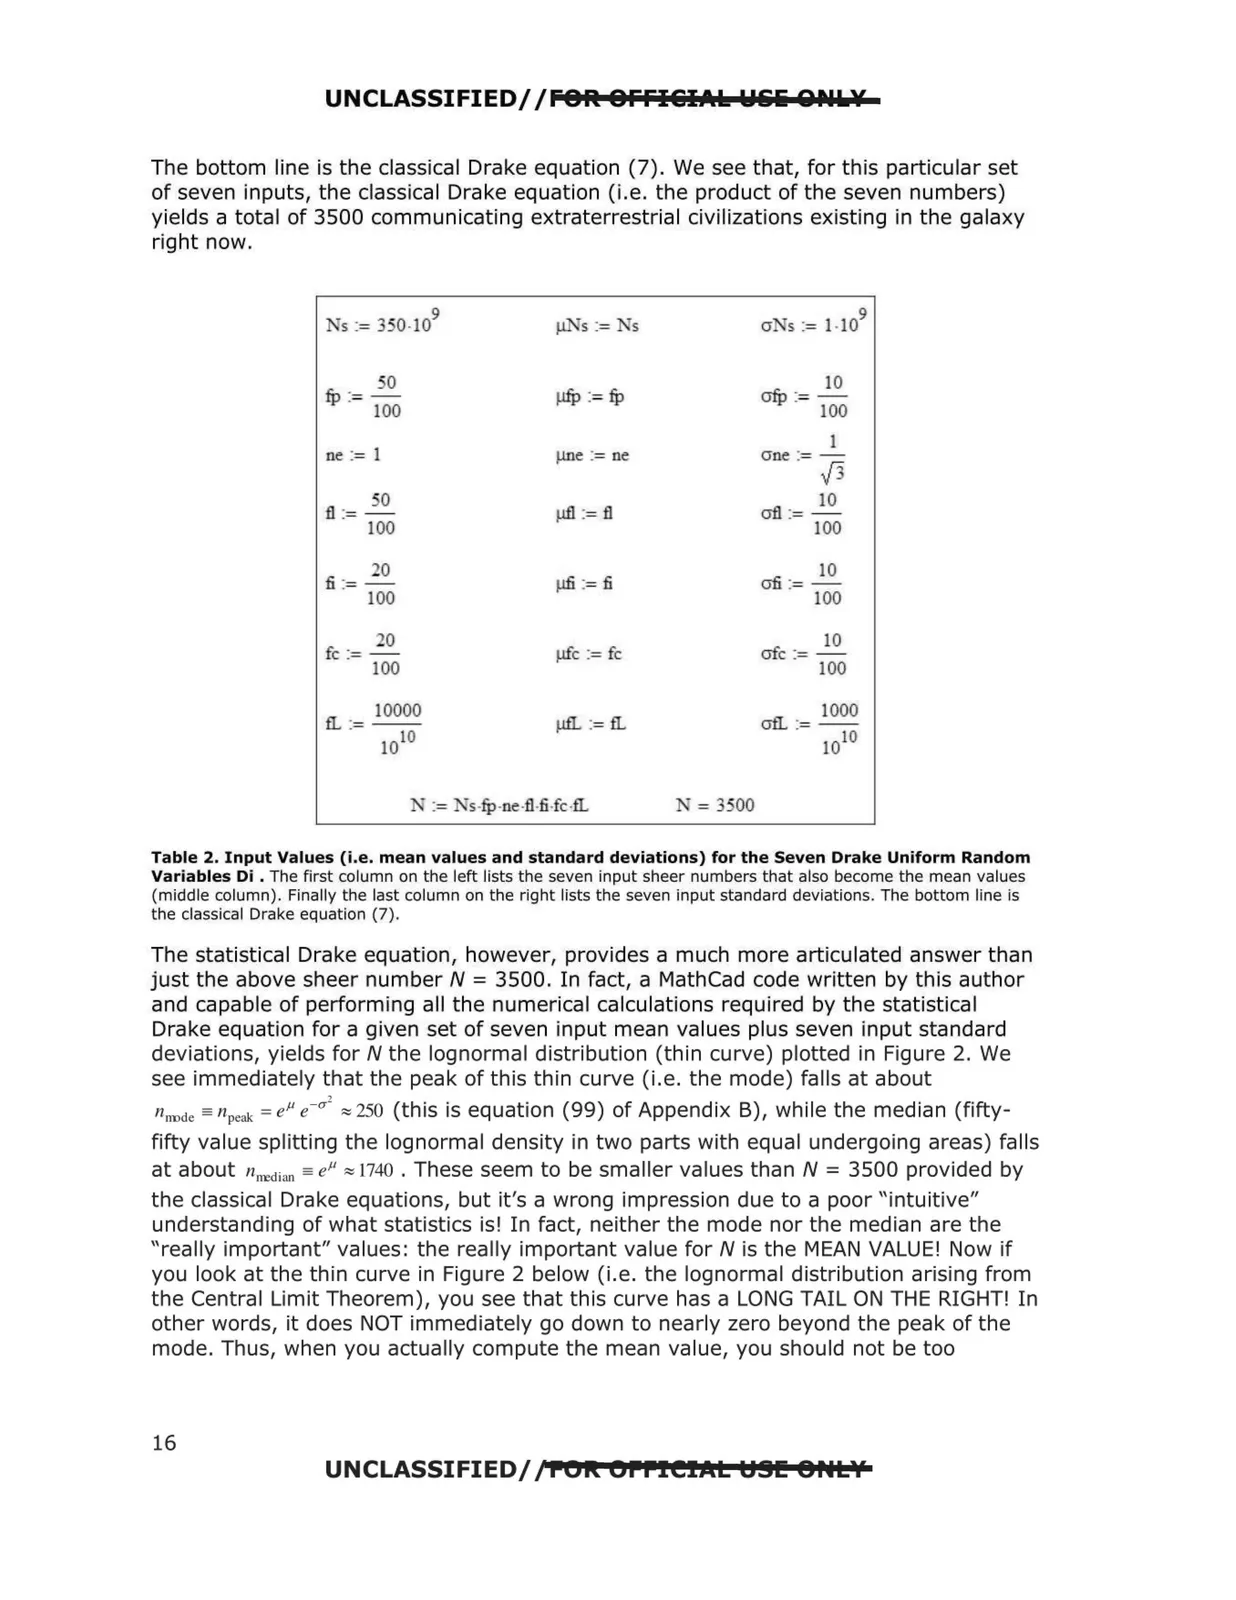
UNCLASSIFIED//FOR OFFIEil.t.k W&i Q~lls¥ The bottom line is the classical Drake equation (7). We see that, for this particular set of seven inputs, the classical Drake equation (i.e. the product of the seven numbers) yields a total of 3500 communicating extraterrestrial civilizations existing in the galaxy right now. rs := 350 -109 s := s 0 10 µfp := fp fp := 100 ofp := 100 l ne := 1 µne := ne crne := /3 0 fl := - µfl := fl crfl := ~ 100 100 fi :=~ µfi := fi on := ~ 100 100 0 fc:= - µfc := fc crfc := ~ 100 100 fL := 10000 crtL := 1000 µfl. := tL 1010 1010 _ 1 := Ks-fp-ne-fl-fi.fc.ff, = 3500 Table 2. Input Values (i.e. mean values and standard deviations) for the Seven Drake Uniform Random Variables Di . The first column on the left lists the seven input sheer numbers that also become the mean values (middle column). Finally the last column on the right lists the seven input standard deviations. The bottom line is the classical Drake equation (7). The statistical Drake equation, however, provides a much more articulated answer than just the above sheer number N = 3500. In fact, a MathCad code written by this author and capable of performing all the numerical calculations required by the statistical Drake equation for a given set of seven input mean values plus seven input standard deviations, yields for N the lognormal distribution (thin curve) plotted in Figure 2. We see immediately that the peak of this thin curve (i.e. the mode) falls at about n rmde;;;; npeak = eµ e-a' ""250 (this is equation (99) of Appendix B), while the median (fifty fifty value splitting the lognormal density in two parts with equal undergoing areas) falls at about nm,dian;;;; eµ ""1740 . These seem to be smaller values than N = 3500 provided by the classical Drake equations, but it's a wrong impression due to a poor "intuitive" understanding of what statistics is! In fact, neither the mode nor the median are the " really important" values: the really important value for N is the MEAN VALUE! Now if you look at the thin curve in Figure 2 below (i.e. the lognormal distribution arising from the Central Limit Theorem), you see that this curve has a LONG TAIL ON THE RIGHT! In other words, it does NOT immediately go down to nearly zero beyond the peak of the mode. Thus, when you actually compute the mean value, you should not be too UNCLASSIFIED// POR OPPICll<L ti.!! er~LV 16