AAWSAP DIRD, An Introduction to the Statistical Drake Equation, March 2010
DOW-UAP-D127 · page 43 of 55
Text
This text came with the file. It may have mistakes. When the text and the image disagree, the image is right.
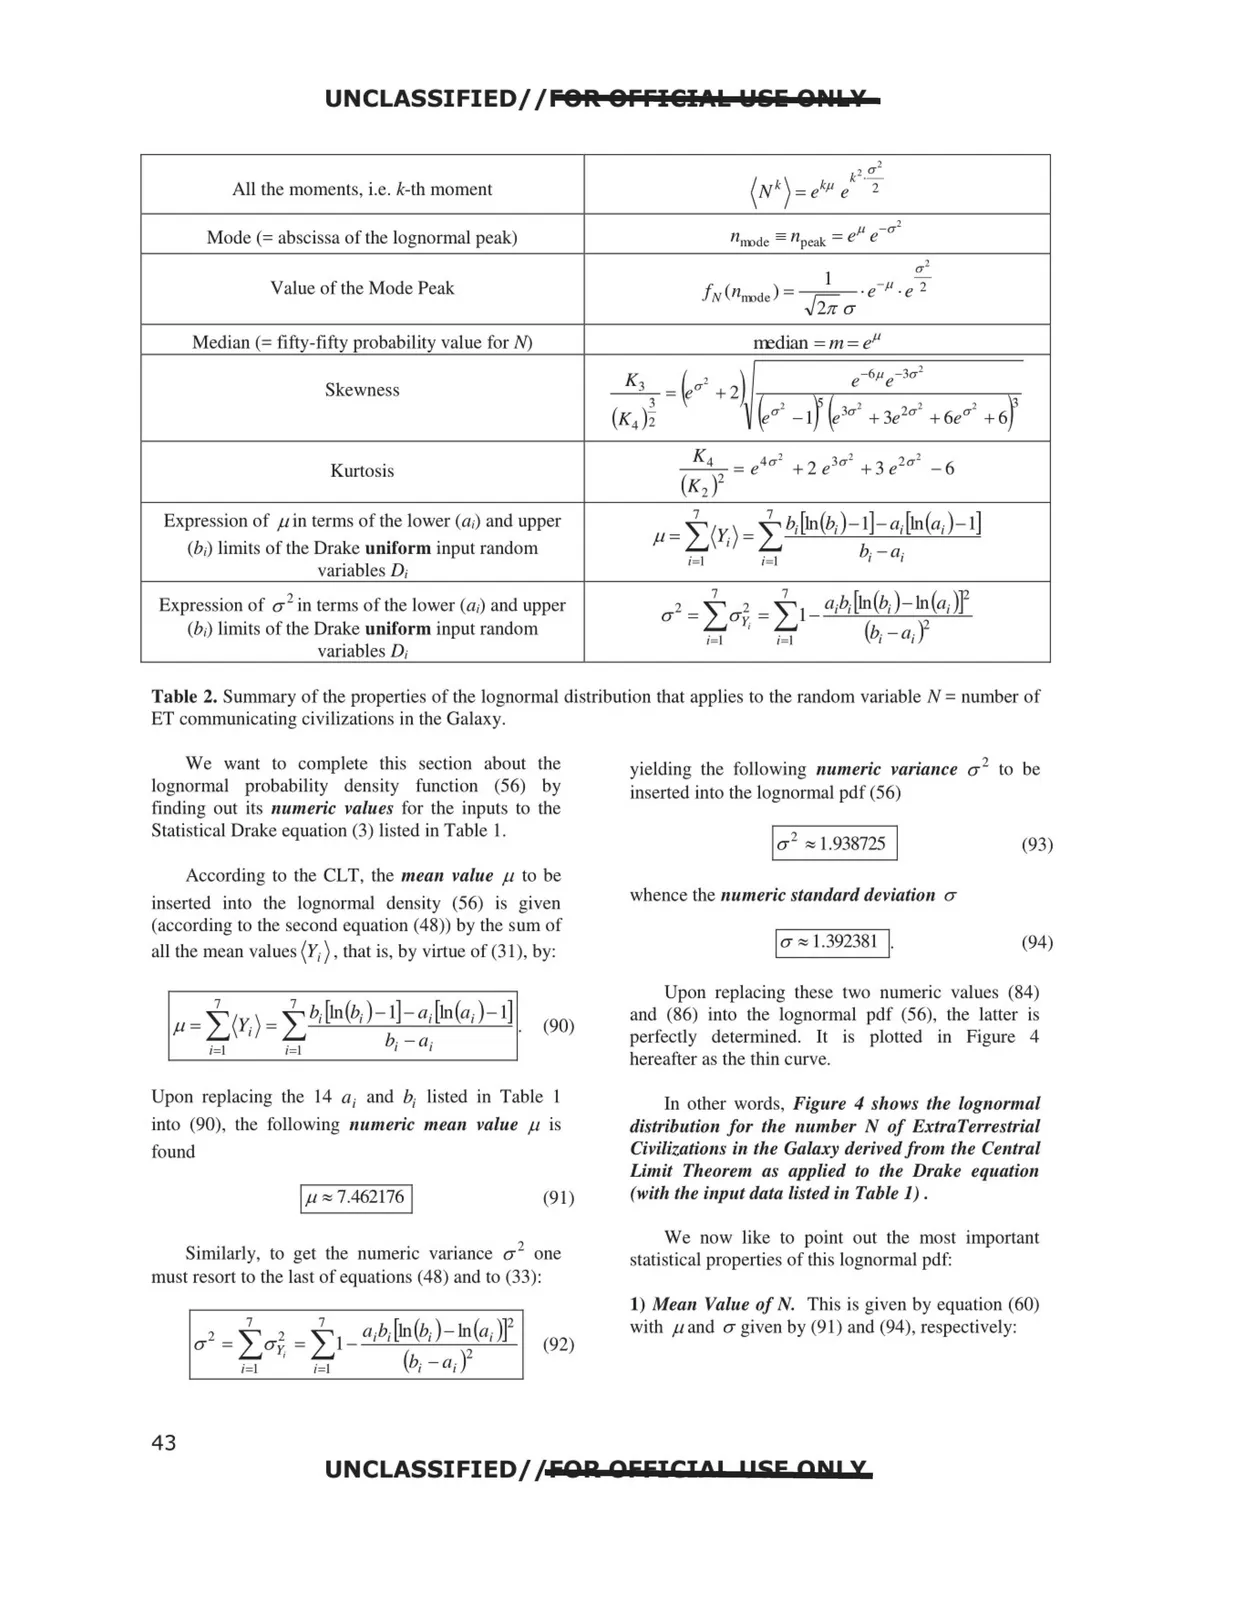
UNCLASSIFIED/ /fOR OFFI&IAk Wlii QPU,¥ All the moments, i.e. k-th moment Mode(= abscissa of the lognormal peak) Value of the Mode Peak Median(= fifty-fifty probability value for N) Skewness Kurtosis Expression of µ in terms of the lower (a;) and upper (b;) limits of the Drake uniform input random variables D; Expression of a 2 in terms of the lower (a;) and upper (b;) limits of the Drake uniform input random variables D; - - JI -a2 nnnde = npeak - e e a l I - 11 , f ( ) N nTIDde = ~ •e •e -,121r a Table 2. Summary of the properties of the lognormal distribution that applies to the random variable N = number of ET communicating civilizations in the Galaxy. We want to complete this section about the lognormal probability density function (56) by finding out its numeric values for the inputs to the Statistical Drake equation (3) listed in Table I. According to the CLT, the mean value µ to be inserted into the lognormal density (56) is given (according to the second equation (48)) by the sum of all the mean values (Y;), that is, by virtue of (31 ), by: Upon replacing the 14 a; and b; listed in Table 1 into (90), the following 11umeric mea11 value µ is found 1µ,,,7.462116 1 (91) Similarly, to get the numeric variance a 2 one must resort to the last of equations (48) and to (33): (92) a 2 yielding the following numeric varia11ce to be inserted into the lognormal pdf (56) la2 ,,, 1.938725 1 (93) whence the numeric standard deviation a 1 a ,,, 1.392381 t- (94) Upon replacing these two numeric values (84) and (86) into the lognormal pdf (56), the latter is perfectly determined. It is plotted in Figure 4 hereafter as the thin curve. In other words, Figure 4 shows the lognormal distribution for the number N of ExtraTerrestrial Civilizations in the Galaxy derived from the Central Limit Theorem as applied to the Drake equation (with the input data listed i11 Table 1). We now like to point out the most important statistical properties of this lognormal pdf: 1) Mean Value of N. This is given by equation (60) with µ and a given by (91) and (94), respectively: UNCLASSIFIED/ /FOR OFFICIO! !!SF ON! X 43