AAWSAP DIRD, An Introduction to the Statistical Drake Equation, March 2010
DOW-UAP-D127 · page 44 of 55
Text
This text came with the file. It may have mistakes. When the text and the image disagree, the image is right.
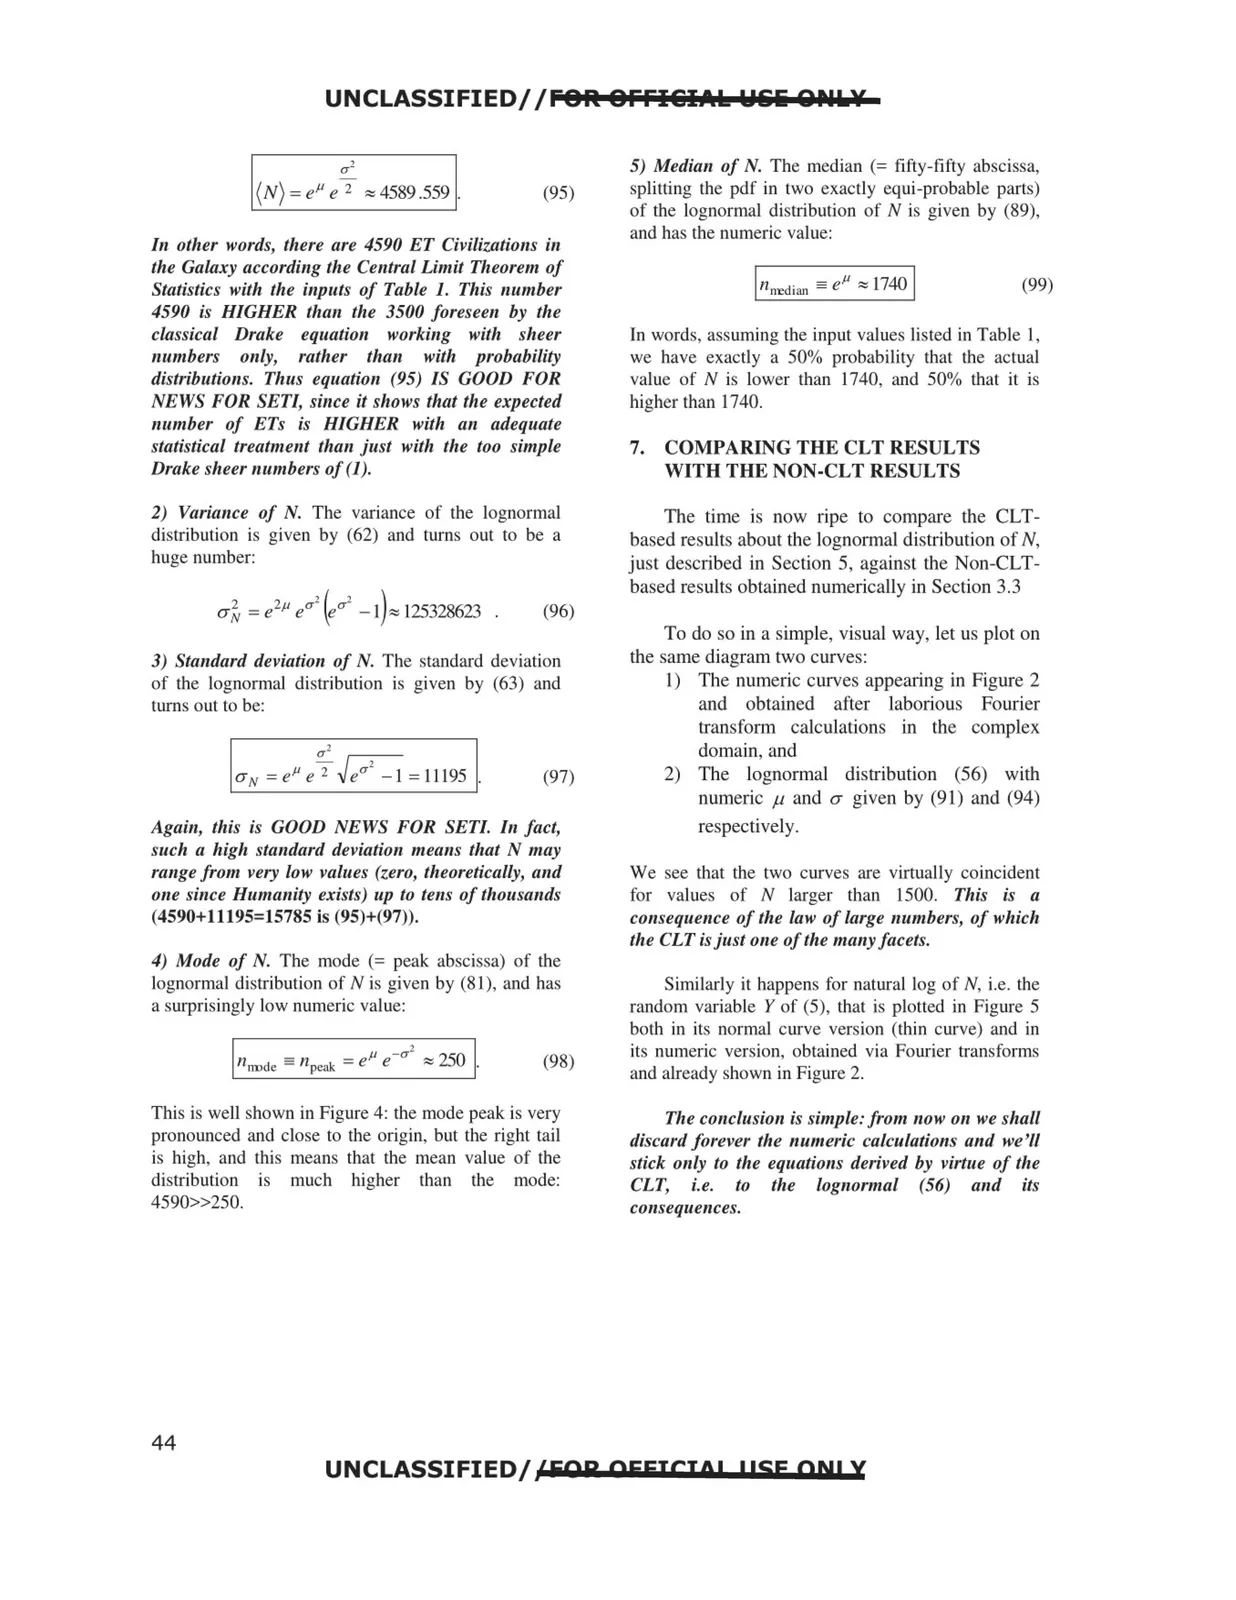
UNCLASSIFIED/ /FOR OFFIEiIAk Wlii QPU,¥ (N) =eµ e 2 "'4589 .559 . (95) In other words, there are 4590 ET Civilizatio11s in the Galaxy according the Central Limit Theorem of Statistics with the inputs of Table 1. This ,mmber 4590 is HIGHER than the 3500 foreseen by the classical Drake equation working with sheer numbers only, rather than with probability distributions. Thus equation (95) IS GOOD FOR NEWS FOR SETI, since it shows that the expected number of ETs is HIGHER with an adequate statistical treatment than just with the too simple Drake sheer numbers of(1). 2) Variance of N. The variance of the Iognormal distribution is given by (62) and turns out to be a huge number: 3) Standard deviation of N. The standard deviation of the lognormal distribution is given by (63) and turns out to be: (97) Again, this is GOOD NEWS FOR SETI. In fact, such a high standard deviation means that N may range from very low values (zero, theoretically, and one since Humanity exists) up to tens of thousands (4590+11195=15785 is (95)+(97)). 4) Mode of N. The mode (= peak abscissa) of the lognormal distribution of N is given by (81 ), and has a surprisingly low numeric value: This is well shown in Figure 4: the mode peak is very pronounced and close to the origin, but the right tail is high, and this means that the mean value of the distribution is much higher than the mode: 4590»250. 5) Median of N. The median (= fifty -fifty abscissa, splitting the pdf in two exactly equi-probable parts) of the lognormal distribution of N is given by (89), and has the numeric value: (99) Tn words, assuming the input values listed in Table 1, we have exactly a 50% probability that the actual value of N is lower than 1740, and 50% that it is higher than 1740. 7. COMPARING THE CLT RESULTS WITH THE NON-CLT RESULTS The time is now ripe to compare the CLT based results about the lognormal distribution of N, just described in Section 5, against the Non-CLT based results obtained numerically in Section 3.3 To do so in a simple, visual way, let us plot on the same diagram two curves: 1) The numeric curves appearing in Figure 2 and obtained after laborious Fourier transform calculations in the complex domain, and 2) The lognormal distribution (56) with numeric µ and a given by (91) and (94) respectively. We see that the two curves are virtually coincident for values of N larger than 1500. This is a consequence of the law of large numbers, of which the CLT is just one ofthe 111a11y facets. Similarly it happens for natural log of N, i.e. the random variable Y of (5), that is plotted in Figure 5 both in its normal curve version (thin curve) and in its numeric version, obtained via Fourier transforms and already shown in Figure 2. The conclusion is simple: from now 011 we shall discard forever the 1111meric calc11lations a11d we'll stick only to the equations derived by virtue of the CLT, i.e. to the lognormal (56) and its co11seque11ces. UNCLASSIFIED//509 OFFICIO! 11SF QN1X 44