AAWSAP DIRD, Technological Approaches to Controlling External Devices, March 2010
DOW-UAP-D130 · page 25 of 36
Text
This text came with the file. It may have mistakes. When the text and the image disagree, the image is right.
UNCLASSIFIED/ /FOR OFFI@Il.tk WSI: Ortklf
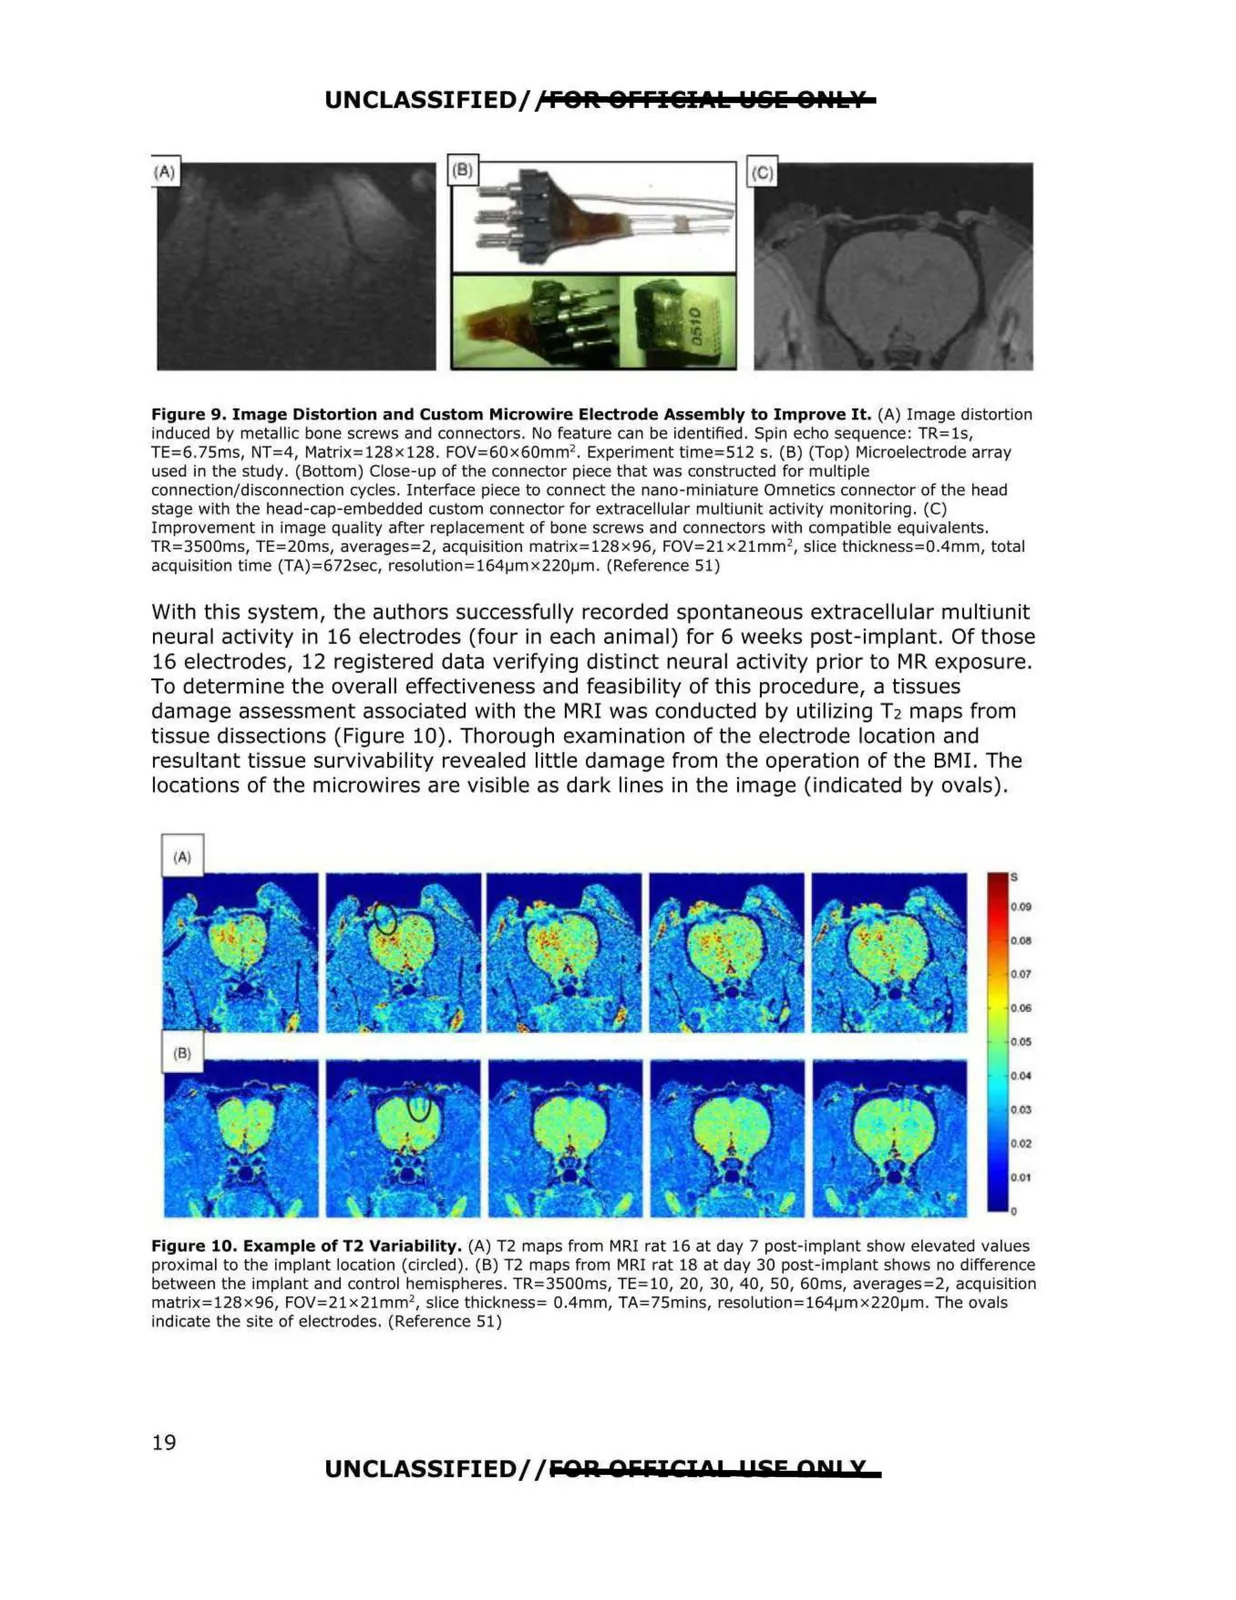
Figure 9. Image Distortion and Custom Microwire Electrode Assembly to Improve It. (A) Image distortion
induced by metallic bone screws and connectors. No feature can be identified. Spin echo sequence: TR=ls,
TE=6.75ms, NT=4, Matrix=128x128. FOV=60x60mm 2 . Experiment time=512 s. (B) (Top) Microelectrode array
used in the study. (Bottom) Close-up of the connector piece that was constructed for multiple
connection/disconnection cycles. Interface piece to connect the nano-miniature Omnetics connector of the head
stage with the head-cap-embedded custom connector for extracellular multiunit activity monitoring. (C)
Improvement in image quality after replacement of bone screws and connectors with compatible equivalents.
TR=3500ms, TE=20ms, averages=2, acquisition matrix=128x96, FOV=21x21mm 2, slice thickness=0.4mm, total
acquisition time (TA)=672sec, resolutlon=164µmx220µm . (Reference 51)
With this system, the authors successfully recorded spontaneous extracellular multiunit
neural activity in 16 electrodes (four in each animal) for 6 weeks post-implant. Of those
16 electrodes, 12 registered data verifying distinct neural activity prior to MR exposure.
To determine the overall effectiveness and feasibility of th is procedure, a tissues
damage assessment associated with the MRI was conducted by utilizing T2 maps from
tissue dissections (Figure 10). Thorough examination of the electrode location and
resultant tissue survivability revealed little damage from the operation of the BMI. The
locations of the microwires are visible as dark lines in the image (indicated by ovals).
$
009
0011
007
006
005
0 04
003
002
0,01
0
Figure 10. Example of T2 Variability, (A) T2 maps from MRI rat 16 at day 7 post-implant show elevated values
proximal to the Implant location (circled). (B) T2 maps from MRI rat 18 at day 30 post-implant shows no difference
between the implant and control hemispheres. TR=3500ms, TE=l0, 20, 30, 40, 50, 60ms, averages=2, acquisition
matrix=128x96, FOV=21x21mm2, slice thickness= 0.4mm, TA=75mins, resolution=164µmx220µm. The ovals
indicate the site of electrodes. (Reference 51)
UNCLASSIFIED/ /fiOlil OfifilCIOP l!SE AN! X
19