AAWSAP DIRD, Cognitive Limits on Simultaneous Control of Multiple Unmanned Spacecraft, December 2010
DOW-UAP-D151 · page 16 of 31
Text
This text came with the file. It may have mistakes. When the text and the image disagree, the image is right.
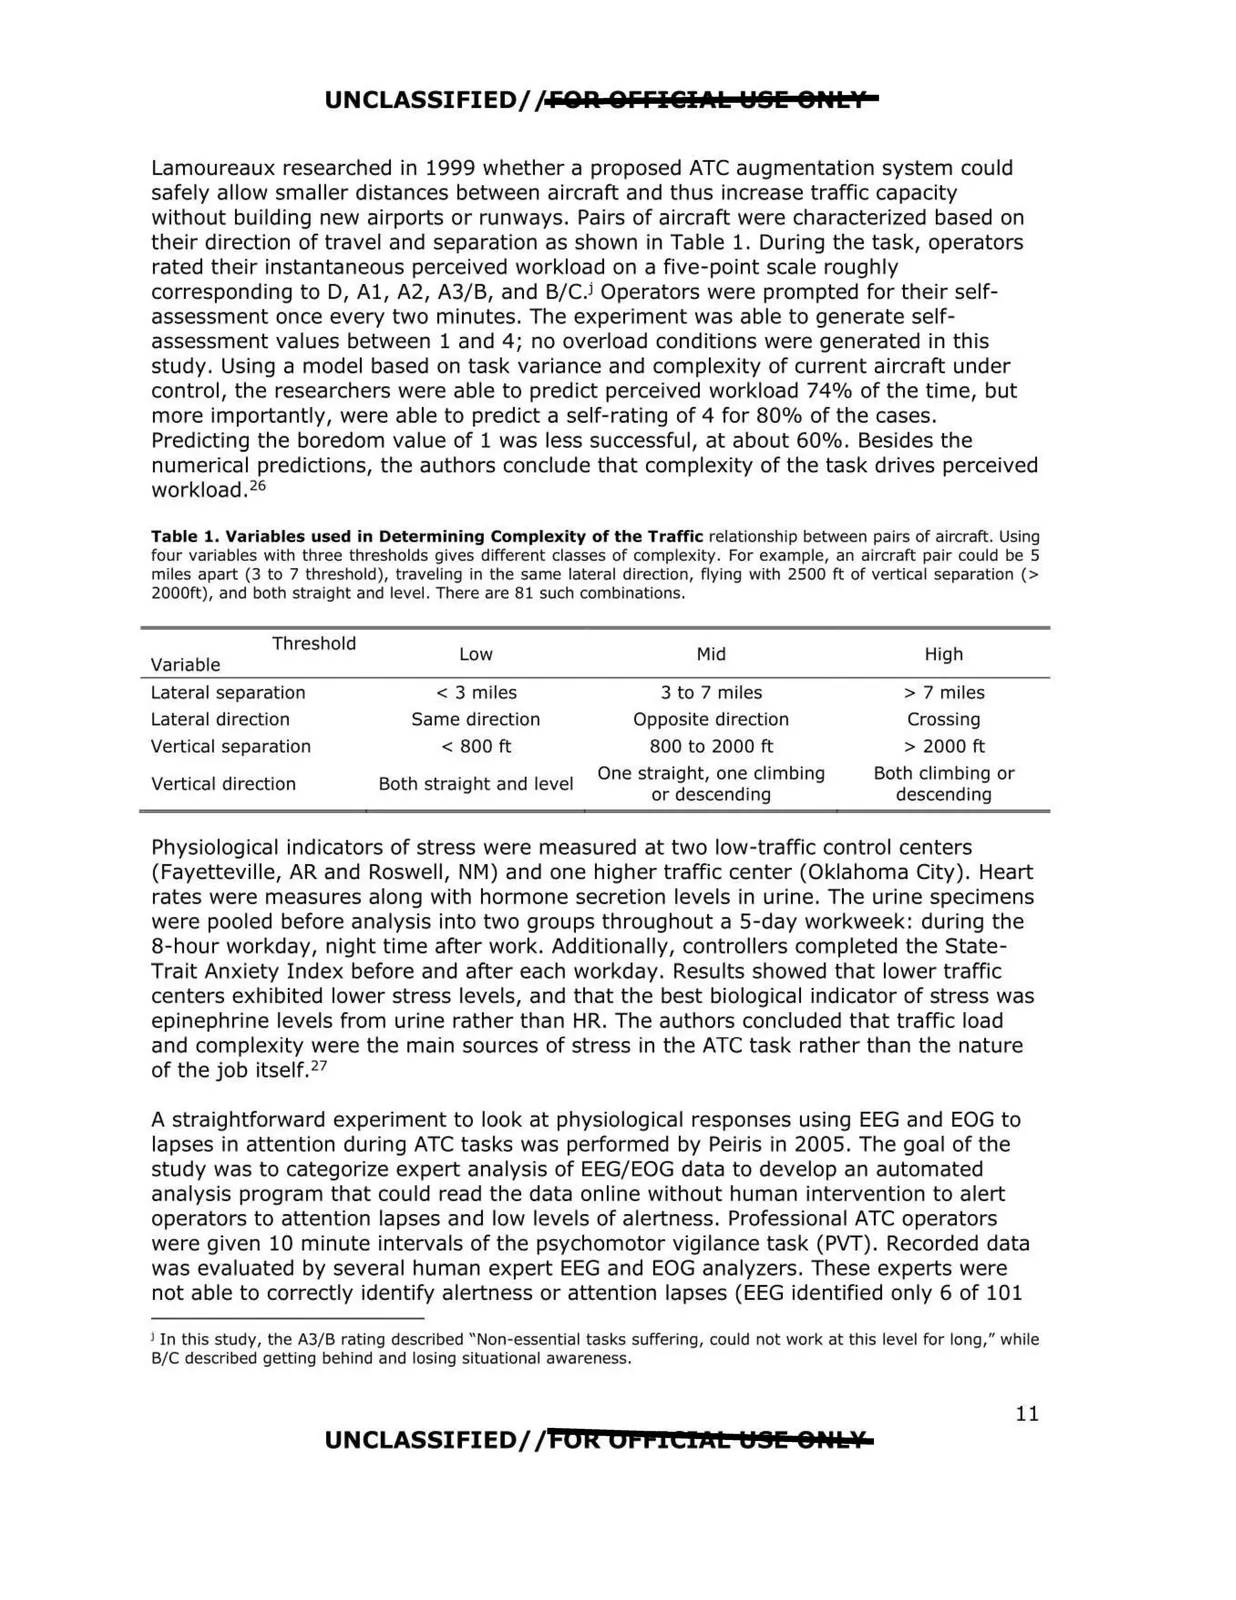
UNCLASSIFIED//FOA QFFI&ilsT.tk WSE 8HLV Lamoureaux researched in 1999 whether a proposed ATC augmentation system could safely allow smaller distances between aircraft and thus increase traffic capacity without building new airports or runways. Pairs of aircraft were characterized based on their direction of travel and separation as shown in Table 1. During the task, operators rated their instantaneous perceived workload on a five-point scale roughly corresponding to D, Al, A2, A3/B, and B/C.i Operators were prompted for their self assessment once every two minutes. The experiment was able to generate self assessment values between 1 and 4; no overload conditions were generated in this study. Using a model based on task variance and complexity of current aircraft under control, the researchers were able to predict perceived workload 74% of the time, but more importantly, were able to predict a self-rating of 4 for 80% of the cases. Predicting the boredom value of 1 was less successful, at about 60%. Besides the numerical predictions, the authors conclude that complexity of the task drives perceived workload . 26 Table 1. Variables used in Determining Complexity of the Traffic relationship between pairs of aircraft. Using four variables with three thresholds gives different classes of complexity. For example, an aircraft pair could be 5 miles apart (3 to 7 threshold), traveling in the same lateral direction, flying with 2500 ft of vertical separation (> 2000ft), and both straight and level. There are 81 such combinations. Variable Threshold Low Mid High Lateral separation < 3 miles 3 to 7 miles > 7 miles Lateral direction Same direction Opposite direction Crossing Vertical separation < 800 ft 800 to 2000 ft > 2000 ft Vertical direction Both straight and level One straight, one climbing or descending Both climbing or descending Physiological indicators of stress were measured at two low-traffic control centers (Fayetteville, AR and Roswell, NM) and one higher traffic center (Oklahoma City). Heart rates were measures along with hormone secretion levels in urine. The urine specimens were pooled before analysis into two groups throughout a 5-day workweek: during the 8-hour workday, night time after work. Additionally, controllers completed the State Trait Anxiety Index before and after each workday. Results showed that lower traffic centers exhibited lower stress levels, and that the best biological indicator of stress was epinephrine levels from urine rather than HR. The authors concluded that traffic load and complexity were the main sources of stress in the ATC task rather than the nature of the job itself. 27 A straightforward experiment to look at physiological responses using EEG and EOG to lapses in attention during ATC tasks was performed by Peiris in 2005. The goal of the study was to categorize expert analysis of EEG/EOG data to develop an automated analysis program that could read the data online without human intervention to alert operators to attention lapses and low levels of alertness. Professional ATC operators were given 10 minute intervals of the psychomotor vigilance task (PVT). Recorded data was evaluated by several human expert EEG and EOG analyzers. These experts were not able to correctly identify alertness or attention lapses (EEG identified only 6 of 101 J In this study, the A3/B rating described "Non-essential tasks suffering, could not work at this level for long," while 8/C described getting behind and losing situational awareness. UNCLASSIFIED//FOR OFFICIAL tJ!H! 8Hklf 11