Department of the Air Force Report, 1996
DOW-UAP-D048 · page 59 of 181
Text
This text came with the file. It may have mistakes. When the text and the image disagree, the image is right.
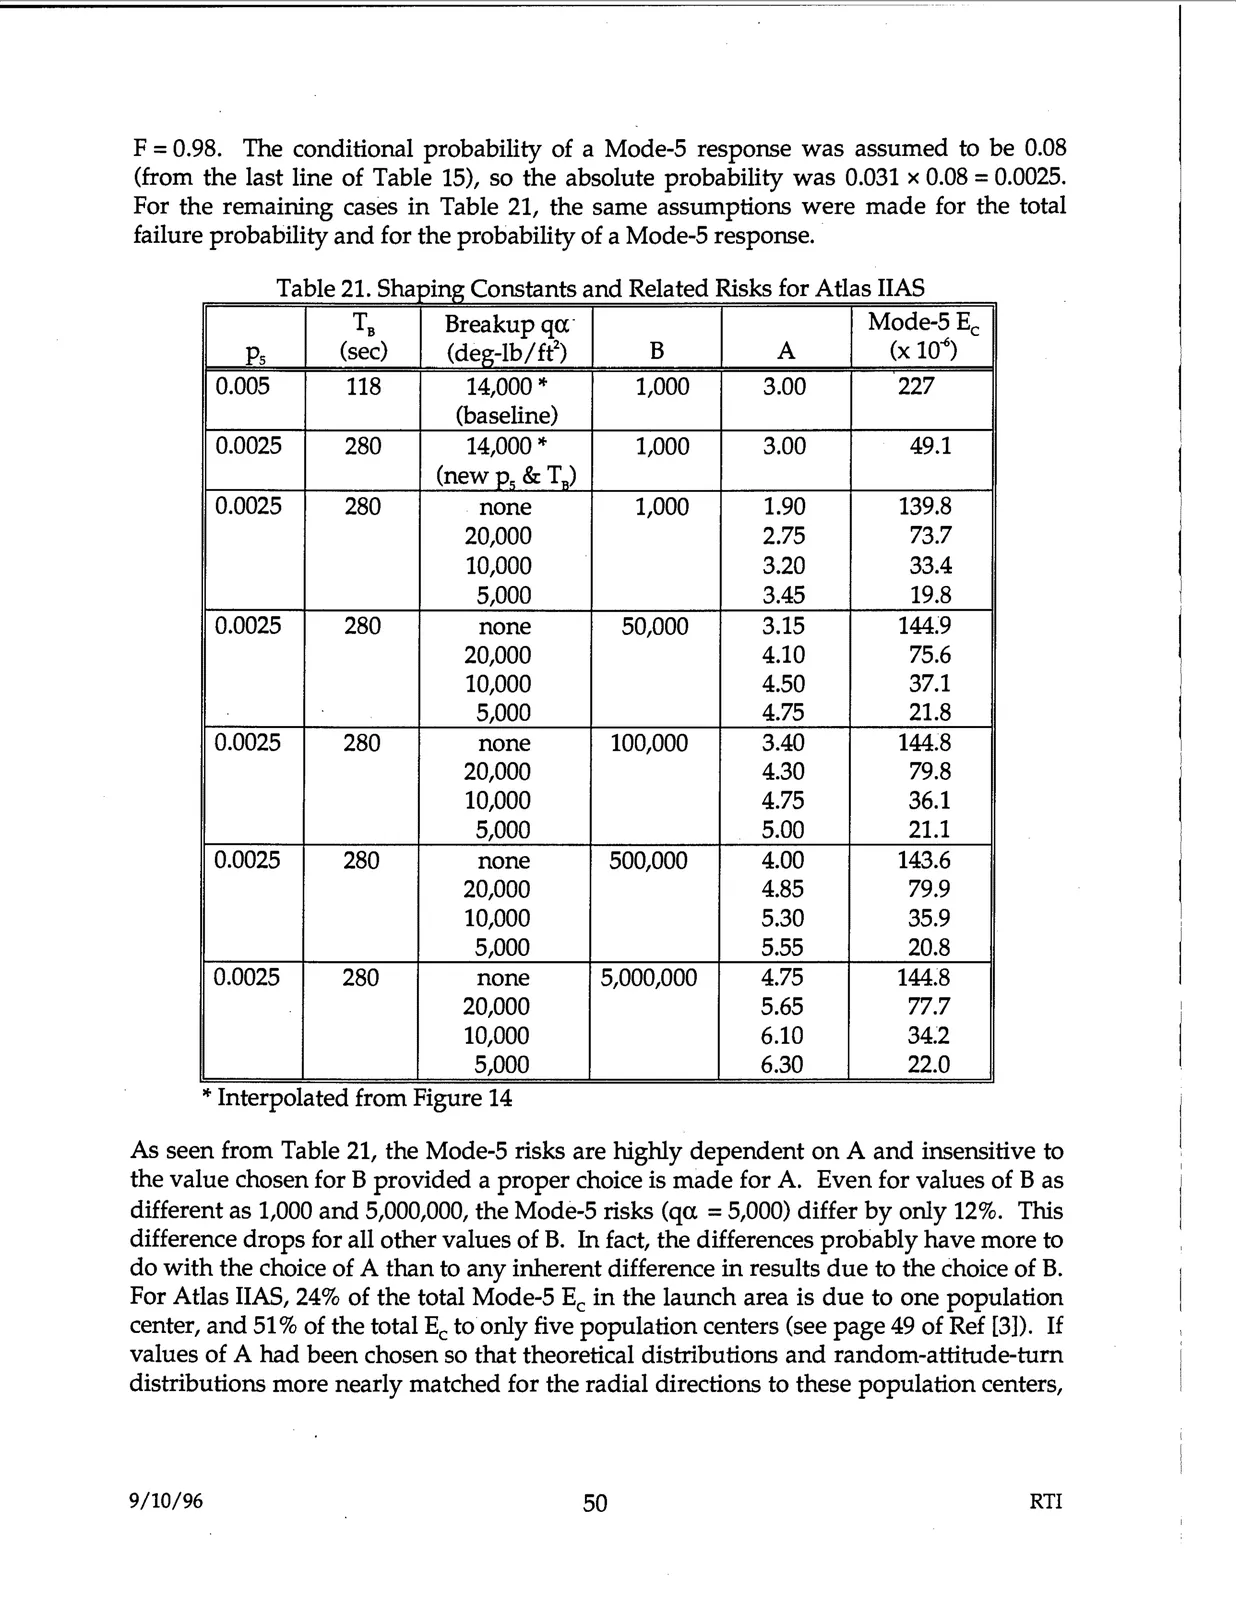
F =0.98. The conditional probability of a Mode-5 response was assumed to be 0.08
(from the last line of Table 15), so the absolute probability was 0.031 x 0.08 = 0.0025.
For the remaining cases in Table 21, the same assumptions were made for the total
failure probability and for the probability of a Mode-5 response. •
a:,mg
Table 21.Sh •
Constants and R 1
eaet d Risks f or Atlas HAS
Ps
TB
(sec)
Breakup qa:·
(deg-lb/ft2)
B
A
Mode-5 Ee
(x 10-6)
0.005
118
14,000 *
1,000
(baseline)
3.00
227
0.0025
280
14,000 *
1,000
3.00
49.1
(new P. & T ..)
0.0025
280
. none
1,000
1.90
139.8
20,000
2.75
73.7
10,000
3.20
33.4
5,000
3.45
19.8
0.0025
280
none
50,000
3.15
144;9
20,000
4.10
75.6
10,000
4.50
37.1
5,000
4.75
21.8
0.0025
280
none
100,000
3.40
144.8
20,000
4.30
79.8
10,000
4.75
36.1
5,000
5.00
21.1
0.0025
280
none
500,000
4.00
143.6
20,000
4.85
79.9
10,000
5.30
35.9
5,000
5.55
20.8
0.0025
280
none
5,000,000
4.75
144.8
20,000
5.65
77.7
10,000
6.10
34.2
5,000
6.30
22.0
* Interpolated from Figure 14
As seen from Table 21, the Mode-5 risks are highly dependent on A and insensitive to
the value chosen for B provided a proper choice is made for A. Even for values of B as
different as 1,000 and 5,000,000, the Mode-5 risks (qa =5,000) differ by only 12%. This
difference drops for all other values of B. In fact, the differences probably have more to
do with the choice of A than to any inherent difference in results due to the choice of B.
For Atlas IIAS, 24% of the total Mode-5 Ee in the launch area is due to one population
center, and 51 % of the total Ee to only five population centers (see page 49 of Ref [3]). If
values of A had been chosen so that theoretical distributions and random-attitude-turn
distributions more nearly matched for the radial directions to these population centers,
9/10/96
50
RTI