Department of the Air Force Report, 1996
DOW-UAP-D048 · page 86 of 181
Text
This text came with the file. It may have mistakes. When the text and the image disagree, the image is right.
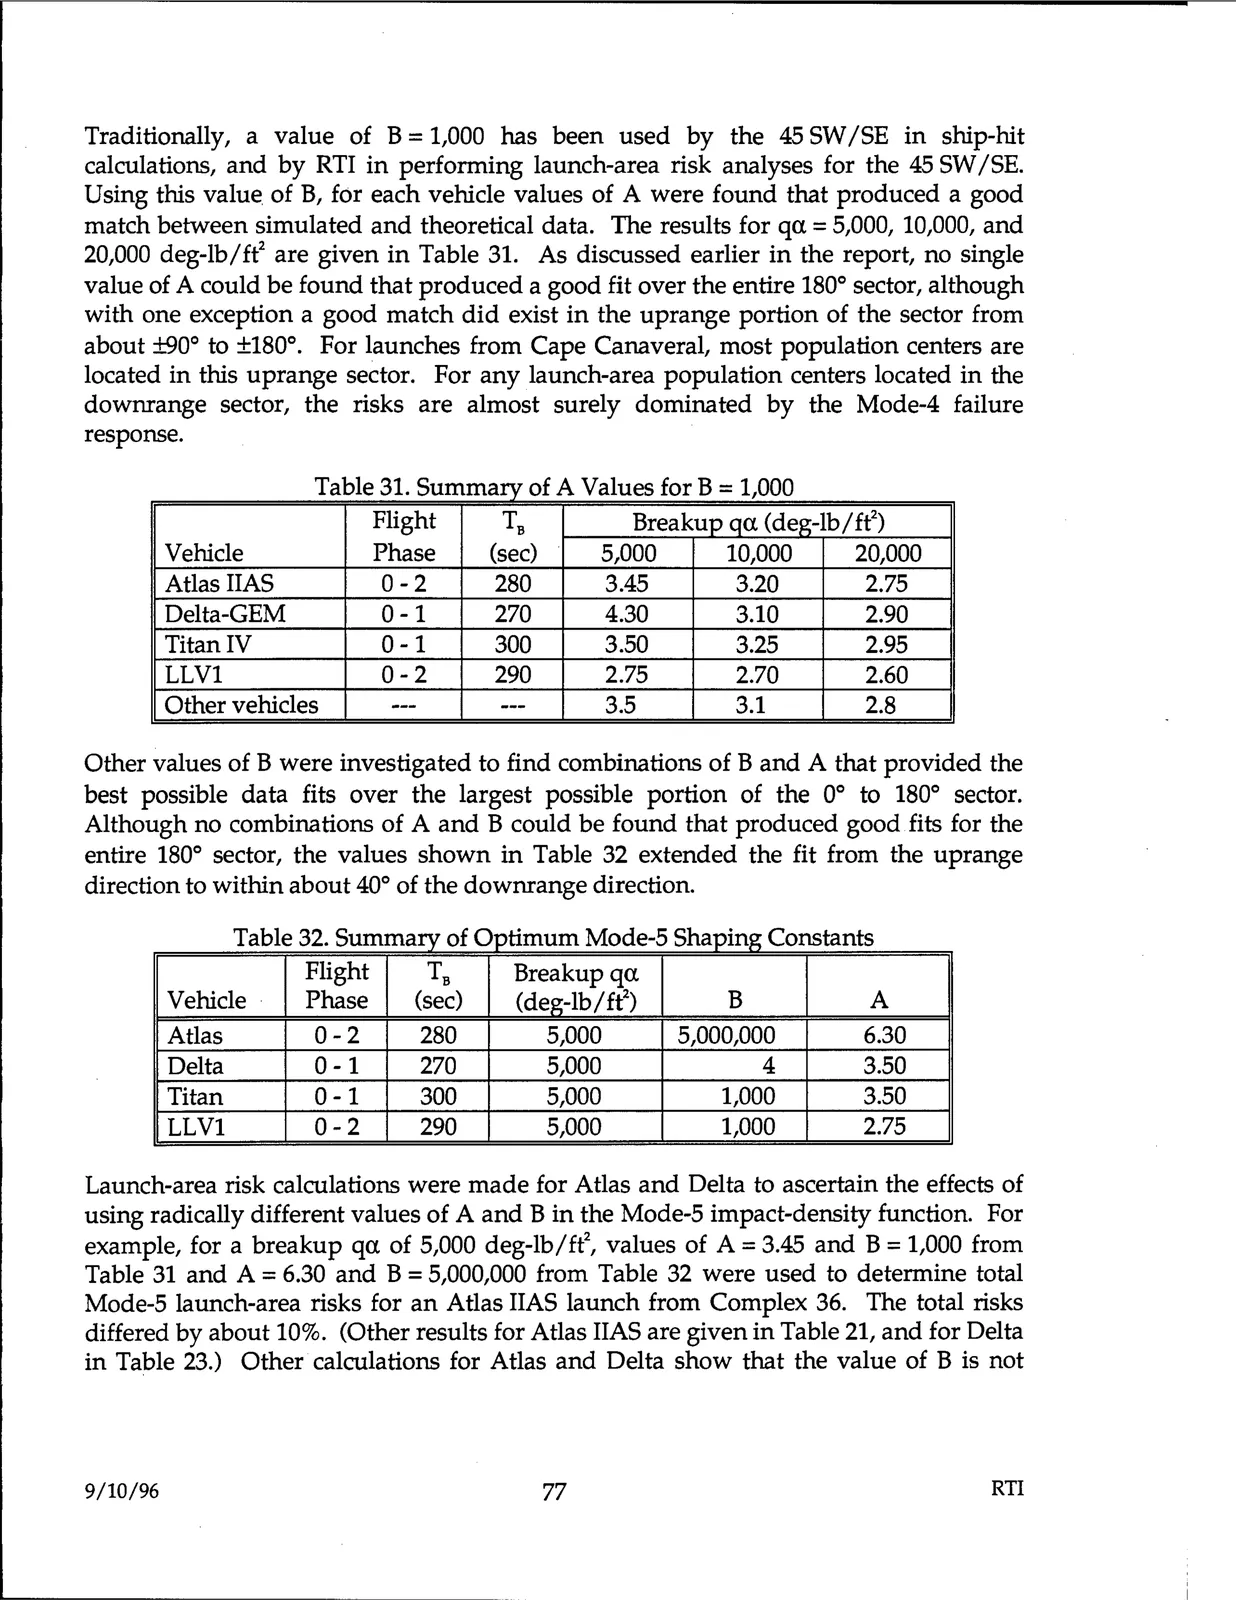
Traditionally, a value of B = 1,000 has been used by the 45 SW/SE in ship-hit
calculations, and by RTI in performing launch-area risk analyses for the 45 SW/SE.
Using this value. of B, for each vehicle values of A were found that produced a good
match between simulated and theoretical data. The results for qa = 5,000, 10,000, and
20,000 deg-lb/ft2 are given in Table 31. As discussed earlier in the report, no single
value of A could be found that produced a good fit over the entire 180° sector, although
with one exception a good match did exist in the uprange portion of the sector from
about ±90° to ±180°. For launches from Cape Canaveral, most population centers are
located in this uprange sector. For any launch-area population centers located in the
downrange sector, the risks are almost surely dominated by the Mode-4 failure
response.
Table 31. Summary of A Values for B = 1,000
Flight
TB
Breakup qa (deg-lb/ft2)
Vehicle
Phase
(sec)
5,000
10,000
20,000
Atlas HAS
0-2
280
3.45
3.20
2.75
Delta-GEM
0-1
270
4.30
3.10
2.90
Titan IV
0-1
300
3.50
3.25
2.95
LLVl
0-2
290
2.75
2.70
2.60
Other vehicles
---
---
3.5
3.1
2.8
Other values of B were investigated to find combinations of B and A that provided the
best possible data fits over the largest possible portion of the 0° to 180° sector.
Although no combinations of A and B could be found that produced good fits for the
entire 180° sector, the values shown in Table 32 extended the fit from the uprange
direction to within about 40° of the downrange direction.
Table 32. Summary of Optimum Mode-5 Shaping Constants
Flight
TB
Breakupqa
Vehicle ·
Phase
(sec)
(deg-lb/ ft2)
B
A
Atlas
0-2
280
5,000
5,000,000
6.30
Delta
0-1
270
5,000
4
3.50
Titan
0-1
300
5,000
1,000
3.50
LLVl
0-2
290
5,000
1,000
2.75
Launch-area risk calculations were made for Atlas and Delta to ascertain the effects of
using radically different values of A and Bin the Mode-5 impact-density function. For
example, for a breakup qa of 5,000 deg-lb/ft2, values of A= 3.45 and B = 1,000 from
Table 31 and A= 6.30 and B = 5,000,000 from Table 32 were used to determine total
Mode-5 launch-area risks for an Atlas HAS launch from Complex 36. The total risks
differed by about 10%. (Other results for Atlas HAS are given in Table 21, and for Delta
in Table 23.) Other calculations for Atlas and Delta show that the value of B is not
9/10/96
77
RTI